
Landlord's Agent in 2018
Mark Graf
Berkshire Hathaway Home Services
(860) 983-4823
17 in this area
59 Total Sales
Estimated Value: $383,413 - $427,000
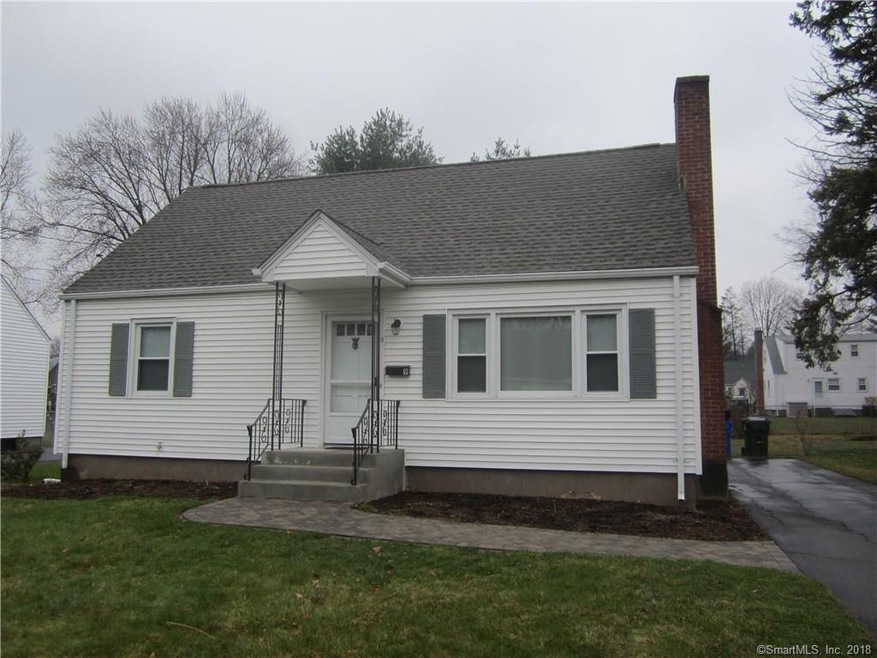
Nicely updated Cape with newer kitchen with SS appliances, granite countertops and recessed lights. Two updated bathrooms with tile flooring one on each floor. Hardwood floors, replacement windows and sliding door to nice size rear deck. There is also gas heat and gas hot water. Tenants must go through tenantverify.net to have credit check, background check and past eviction report done at tenants expense. GHAR lease to be used.
| Date | Event | Price | List to Sale | Price per Sq Ft | Prior Sale |
|---|---|---|---|---|---|
| 05/25/2018 05/25/18 | Rented | $2,200 | 0.0% | -- | |
| 05/11/2018 05/11/18 | Under Contract | -- | -- | -- | |
| 04/10/2018 04/10/18 | For Rent | $2,200 | 0.0% | -- | |
| 08/18/2015 08/18/15 | Sold | $150,000 | -6.2% | $174 / Sq Ft | View Prior Sale |
| 06/30/2015 06/30/15 | Pending | -- | -- | -- | |
| 06/24/2015 06/24/15 | For Sale | $159,900 | -- | $185 / Sq Ft |
| Year | Tax Paid | Tax Assessment Tax Assessment Total Assessment is a certain percentage of the fair market value that is determined by local assessors to be the total taxable value of land and additions on the property. | Land | Improvement |
|---|---|---|---|---|
| 2025 | $7,968 | $177,940 | $55,720 | $122,220 |
| 2024 | $7,536 | $177,940 | $55,720 | $122,220 |
| 2023 | $7,281 | $177,940 | $55,720 | $122,220 |
| 2022 | $7,239 | $177,940 | $55,720 | $122,220 |
| 2021 | $6,429 | $151,550 | $53,620 | $97,930 |
| 2020 | $5,750 | $137,550 | $45,150 | $92,400 |
| 2019 | $5,750 | $137,550 | $45,150 | $92,400 |
| 2018 | $5,723 | $139,580 | $45,150 | $94,430 |
| 2017 | $5,728 | $139,580 | $45,150 | $94,430 |
| 2016 | $5,636 | $142,660 | $52,500 | $90,160 |
| 2015 | $4,800 | $125,300 | $52,500 | $72,800 |
| 2014 | $4,682 | $125,300 | $52,500 | $72,800 |
Landlord's Agent in 2018
Mark Graf
Berkshire Hathaway Home Services
(860) 983-4823
17 in this area
59 Total Sales
J
Seller's Agent in 2015
Janice Carter Hall
Coldwell Banker Realty
Source: SmartMLS
MLS Number: 170070782
APN: WHAR-000016F-003371-000009
Disclaimer: Certain information contained herein is derived from information provided by parties other than Homes.com. All information provided is deemed reliable, but is not guaranteed to be accurate and should be independently verified.
![]() IDX information is provided exclusively for personal, non-commercial use, and may not be used for any purpose other than to identify prospective properties consumers may be interested in purchasing. Information is deemed reliable but not guaranteed.
IDX information is provided exclusively for personal, non-commercial use, and may not be used for any purpose other than to identify prospective properties consumers may be interested in purchasing. Information is deemed reliable but not guaranteed.