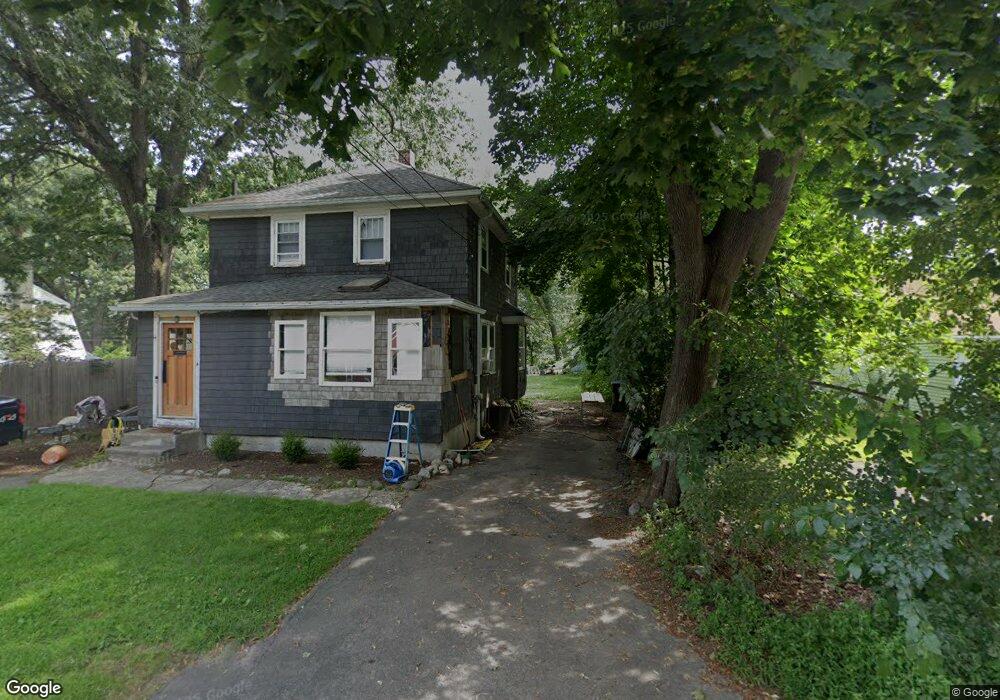
9 Magnolia Rd Natick, MA 01760
Estimated Value: $603,000 - $732,000
3
Beds
2
Baths
1,436
Sq Ft
$456/Sq Ft
Est. Value
About This Home
This home is located at 9 Magnolia Rd, Natick, MA 01760 and is currently estimated at $655,164, approximately $456 per square foot. 9 Magnolia Rd is a home located in Middlesex County with nearby schools including Natick High School, Bennett-Hemenway (Ben-Hem) Elementary School, and Wilson Middle School.
Ownership History
Date
Name
Owned For
Owner Type
Purchase Details
Closed on
May 10, 2023
Sold by
Carr Ryan
Bought by
Carr Ryan and Santiccioli Wallace
Current Estimated Value
Home Financials for this Owner
Home Financials are based on the most recent Mortgage that was taken out on this home.
Original Mortgage
$480,000
Outstanding Balance
$465,365
Interest Rate
5.88%
Mortgage Type
Adjustable Rate Mortgage/ARM
Estimated Equity
$189,799
Purchase Details
Closed on
Aug 30, 1988
Sold by
Mcauley Steven M
Bought by
Wenner Mark
Home Financials for this Owner
Home Financials are based on the most recent Mortgage that was taken out on this home.
Original Mortgage
$135,100
Interest Rate
10.36%
Mortgage Type
Purchase Money Mortgage
Create a Home Valuation Report for This Property
The Home Valuation Report is an in-depth analysis detailing your home's value as well as a comparison with similar homes in the area
Home Values in the Area
Average Home Value in this Area
Purchase History
| Date | Buyer | Sale Price | Title Company |
|---|---|---|---|
| Carr Ryan | -- | None Available | |
| Carr Ryan | -- | None Available | |
| Wenner Mark | $168,900 | -- |
Source: Public Records
Mortgage History
| Date | Status | Borrower | Loan Amount |
|---|---|---|---|
| Open | Carr Ryan | $480,000 | |
| Closed | Carr Ryan | $480,000 | |
| Previous Owner | Wenner Mark | $132,000 | |
| Previous Owner | Wenner Mark | $131,950 | |
| Previous Owner | Wenner Mark | $58,000 | |
| Previous Owner | Wenner Mark | $135,100 |
Source: Public Records
Tax History
| Year | Tax Paid | Tax Assessment Tax Assessment Total Assessment is a certain percentage of the fair market value that is determined by local assessors to be the total taxable value of land and additions on the property. | Land | Improvement |
|---|---|---|---|---|
| 2025 | $6,633 | $554,600 | $382,600 | $172,000 |
| 2024 | $6,397 | $521,800 | $360,100 | $161,700 |
| 2023 | $6,549 | $518,100 | $346,600 | $171,500 |
| 2022 | $6,365 | $477,100 | $315,100 | $162,000 |
| 2021 | $6,089 | $447,400 | $297,100 | $150,300 |
| 2020 | $5,905 | $433,900 | $283,600 | $150,300 |
| 2019 | $5,515 | $433,900 | $283,600 | $150,300 |
| 2018 | $5,413 | $414,800 | $270,100 | $144,700 |
| 2017 | $5,012 | $371,500 | $229,600 | $141,900 |
| 2016 | $4,640 | $341,900 | $201,300 | $140,600 |
| 2015 | $4,569 | $330,600 | $201,300 | $129,300 |
Source: Public Records
Map
Nearby Homes
- 5 Griffin Cir
- 136 Commonwealth Rd
- 50 Wethersfield Rd
- 2 Darby Ct
- 83 Felch Rd
- 293 Bacon St Unit A
- 4 Richard Rd
- 1 Richard Rd
- 29 Irving Rd
- 25 Irving Rd
- 8 Liberty St
- 45 W Plain St Unit 1
- 7 Jackson Ct Unit B
- 40 Nouvelle Way Unit 441
- 186 Main St
- 27 2nd St
- 138 W Plain St
- 41 Charles St
- 44 Harwood Rd
- 5 Haven Ln
Your Personal Tour Guide
Ask me questions while you tour the home.