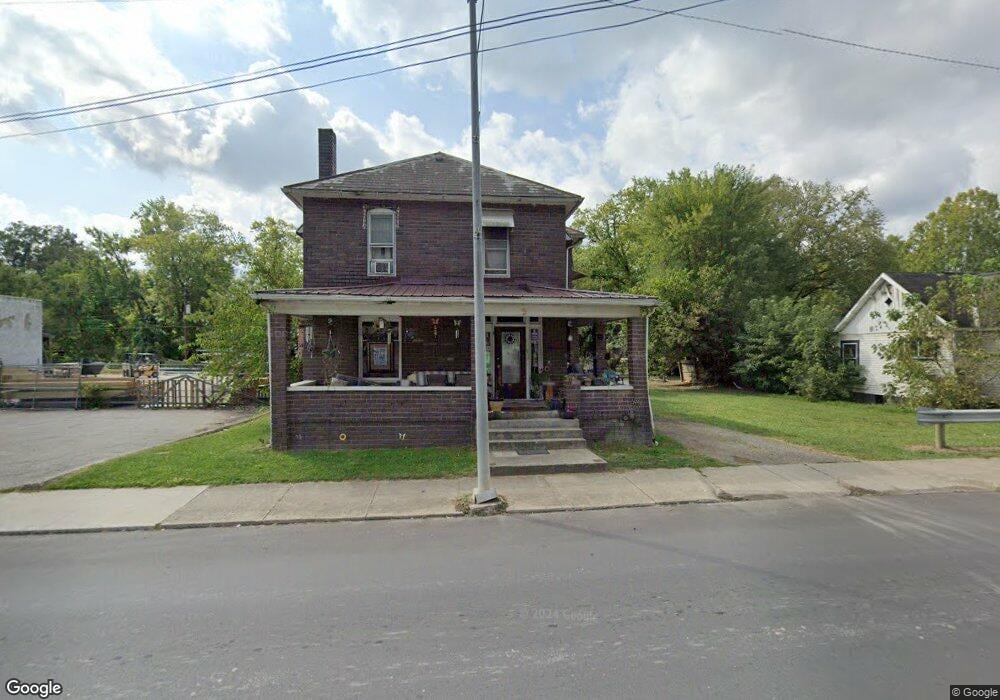
9 Main St Glouster, OH 45732
Estimated Value: $76,000 - $121,000
4
Beds
2
Baths
1,680
Sq Ft
$56/Sq Ft
Est. Value
About This Home
This home is located at 9 Main St, Glouster, OH 45732 and is currently estimated at $94,697, approximately $56 per square foot. 9 Main St is a home located in Athens County with nearby schools including Trimble Elementary School, Trimble Middle School, and Trimble High School.
Ownership History
Date
Name
Owned For
Owner Type
Purchase Details
Closed on
Oct 31, 2022
Sold by
Bush Candi
Bought by
Bush Jacob and Bush Emily
Current Estimated Value
Purchase Details
Closed on
Oct 5, 2022
Sold by
Lucas Joe
Bought by
Bush Candi
Purchase Details
Closed on
Sep 26, 2019
Sold by
Bush Jeffrey Allen and Bush Candi Sue
Bought by
Lucas Joseph E and Lucas Joe
Purchase Details
Closed on
Nov 13, 2013
Sold by
Lucas Joseph and Lucas Beverly
Bought by
Bush Jeffrey Allen and Bush Candi Sue
Purchase Details
Closed on
Mar 7, 2012
Sold by
The First National Bank Of Mcconnelsvill
Bought by
Lucas Joseph and Lucas Beverly
Purchase Details
Closed on
Jan 16, 2012
Sold by
Withem Florence and Withem Florence V
Bought by
The First National Bank Of Mcconnelsvill
Purchase Details
Closed on
Mar 26, 2004
Sold by
Eberts Bertine
Bought by
Withem Florence
Purchase Details
Closed on
Sep 26, 2002
Sold by
Eberts Ovid and Eberts Bertine
Bought by
Eberts Bertine
Create a Home Valuation Report for This Property
The Home Valuation Report is an in-depth analysis detailing your home's value as well as a comparison with similar homes in the area
Purchase History
| Date | Buyer | Sale Price | Title Company |
|---|---|---|---|
| Bush Jacob | -- | -- | |
| Bush Jacob | -- | None Listed On Document | |
| Bush Candi | $4,625 | -- | |
| Bush Candi | $4,625 | None Listed On Document | |
| Lucas Joseph E | -- | None Available | |
| Bush Jeffrey Allen | -- | Attorney | |
| Lucas Joseph | $10,000 | Attorney | |
| The First National Bank Of Mcconnelsvill | $18,667 | Attorney | |
| Withem Florence | $26,500 | -- | |
| Eberts Bertine | -- | -- |
Source: Public Records
Tax History
| Year | Tax Paid | Tax Assessment Tax Assessment Total Assessment is a certain percentage of the fair market value that is determined by local assessors to be the total taxable value of land and additions on the property. | Land | Improvement |
|---|---|---|---|---|
| 2024 | $647 | $12,920 | $530 | $12,390 |
| 2023 | $637 | $12,920 | $530 | $12,390 |
| 2022 | $565 | $10,890 | $530 | $10,360 |
| 2021 | $576 | $10,890 | $530 | $10,360 |
| 2020 | $558 | $10,890 | $530 | $10,360 |
| 2019 | $540 | $10,040 | $470 | $9,570 |
| 2018 | $586 | $10,040 | $470 | $9,570 |
| 2017 | $790 | $10,040 | $470 | $9,570 |
| 2016 | $562 | $9,350 | $470 | $8,880 |
| 2015 | $731 | $9,350 | $470 | $8,880 |
| 2014 | $731 | $9,350 | $470 | $8,880 |
| 2013 | $674 | $9,650 | $450 | $9,200 |
Source: Public Records
Map
Nearby Homes
Your Personal Tour Guide
Ask me questions while you tour the home.