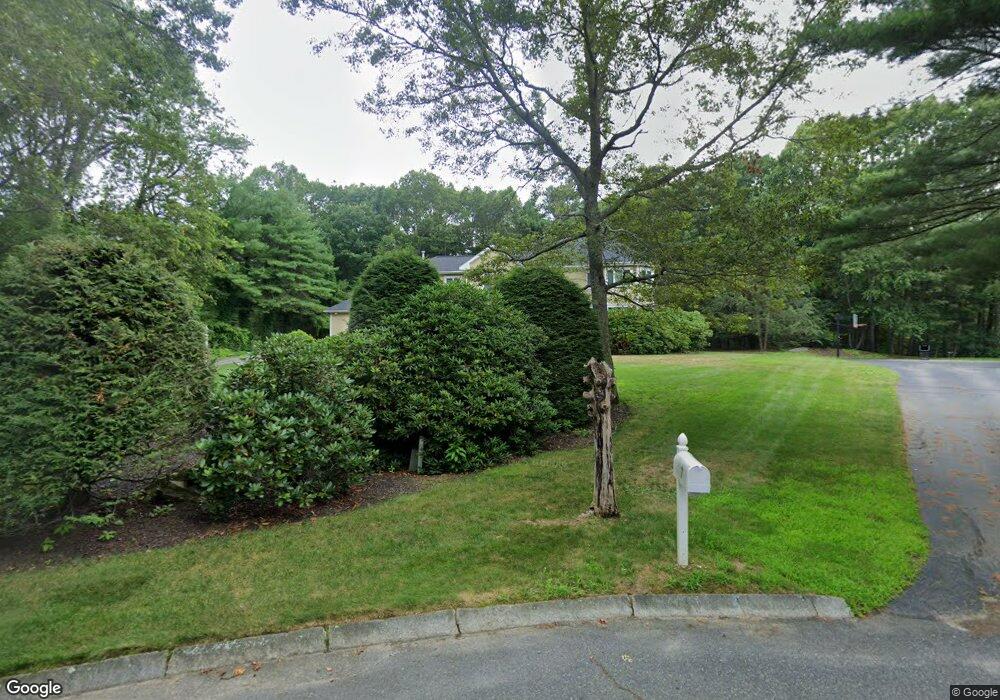
9 Manning Way Sharon, MA 02067
Estimated Value: $1,422,028 - $1,661,000
4
Beds
5
Baths
4,138
Sq Ft
$374/Sq Ft
Est. Value
About This Home
This home is located at 9 Manning Way, Sharon, MA 02067 and is currently estimated at $1,549,507, approximately $374 per square foot. 9 Manning Way is a home located in Norfolk County with nearby schools including East Elementary School, Sharon Middle School, and Sharon High School.
Ownership History
Date
Name
Owned For
Owner Type
Purchase Details
Closed on
Apr 21, 2023
Sold by
Yaffe Lawrence J and Yaffe Deborah K
Bought by
Yaffe Int
Current Estimated Value
Purchase Details
Closed on
Feb 16, 2016
Bought by
Yaffe Lawrence J and Yaffe Deborah K
Home Financials for this Owner
Home Financials are based on the most recent Mortgage that was taken out on this home.
Original Mortgage
$565,000
Interest Rate
3%
Mortgage Type
Adjustable Rate Mortgage/ARM
Purchase Details
Closed on
Jul 14, 2005
Sold by
Parton Joanne
Bought by
Yaffe Deborah K and Yaffe Lawrence J
Purchase Details
Closed on
Jul 1, 2004
Sold by
Parton Hal B and Parton Joanne
Bought by
Parton Joanne
Purchase Details
Closed on
Apr 1, 1994
Sold by
Dicks Earl W and Dicks Steven E
Bought by
Suburban Builders Corp
Purchase Details
Closed on
Oct 1, 1993
Sold by
Suburban Bldrs Corp
Bought by
Parton Hal B and Parton Joanne
Create a Home Valuation Report for This Property
The Home Valuation Report is an in-depth analysis detailing your home's value as well as a comparison with similar homes in the area
Home Values in the Area
Average Home Value in this Area
Purchase History
| Date | Buyer | Sale Price | Title Company |
|---|---|---|---|
| Yaffe Int | -- | None Available | |
| Yaffe Lawrence J | -- | -- | |
| Yaffe Deborah K | $1,025,000 | -- | |
| Parton Joanne | -- | -- | |
| Suburban Builders Corp | $141,000 | -- | |
| Parton Hal B | $465,000 | -- |
Source: Public Records
Mortgage History
| Date | Status | Borrower | Loan Amount |
|---|---|---|---|
| Previous Owner | Yaffe Lawrence J | $565,000 | |
| Previous Owner | Parton Hal B | $417,000 | |
| Previous Owner | Parton Hal B | $417,000 |
Source: Public Records
Tax History Compared to Growth
Tax History
| Year | Tax Paid | Tax Assessment Tax Assessment Total Assessment is a certain percentage of the fair market value that is determined by local assessors to be the total taxable value of land and additions on the property. | Land | Improvement |
|---|---|---|---|---|
| 2025 | $23,229 | $1,328,900 | $464,300 | $864,600 |
| 2024 | $22,564 | $1,283,500 | $426,000 | $857,500 |
| 2023 | $21,172 | $1,138,900 | $398,300 | $740,600 |
| 2022 | $20,516 | $1,038,800 | $331,800 | $707,000 |
| 2021 | $20,424 | $999,700 | $312,900 | $686,800 |
| 2020 | $19,264 | $1,013,900 | $327,100 | $686,800 |
| 2019 | $18,703 | $963,600 | $276,800 | $686,800 |
| 2018 | $18,562 | $958,300 | $271,500 | $686,800 |
| 2017 | $18,908 | $963,700 | $307,000 | $656,700 |
| 2016 | $18,220 | $906,000 | $307,000 | $599,000 |
| 2015 | $18,110 | $892,100 | $279,400 | $612,700 |
| 2014 | $17,778 | $865,100 | $302,100 | $563,000 |
Source: Public Records
Map
Nearby Homes
- 172 Wilshire Dr
- 15 Sparrow Rd
- 20 Sparrow Rd
- 16 Deerfield Rd
- 115 Joanne Rd
- 40 Lyndon Rd
- 30 Hampton Rd
- 12 Eastwood Rd
- 343 West St
- 11 Springwood Ave
- 17 Donald Rd
- 2040 Central St
- 40 Bayberry Dr Unit 1
- 32 Marys Way
- 103 Kim Terrace Unit A
- 74 Ethyl Way
- 35 Patricia Dr
- 17 Patricia Dr
- 4 Bayberry Dr Unit 3
- 8 Patricia Dr