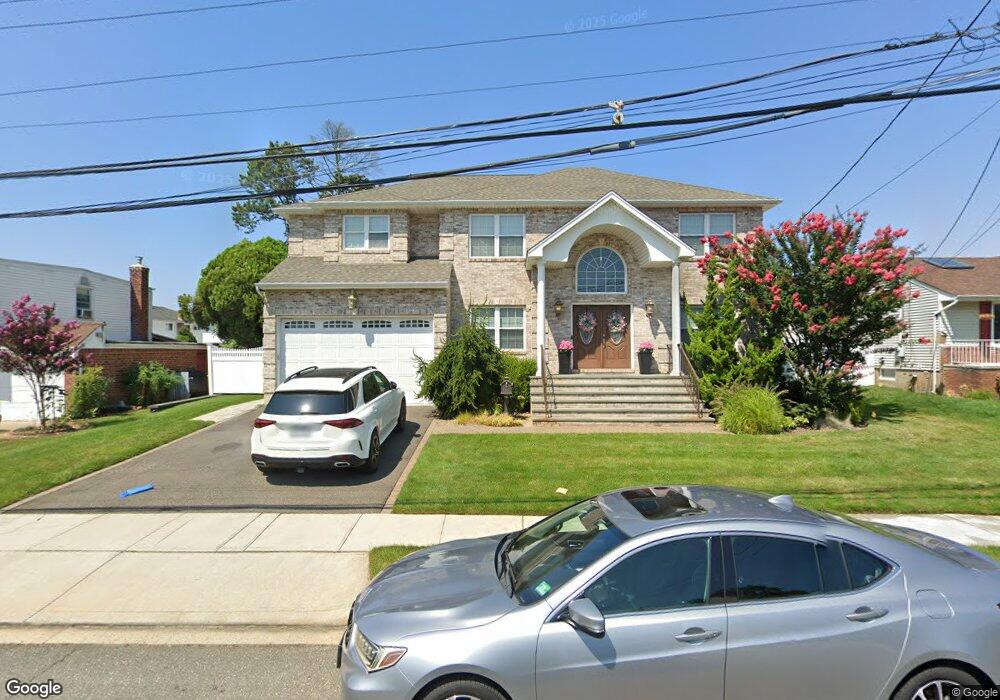
9 Maple St Massapequa, NY 11758
Estimated Value: $1,179,000 - $1,180,402
3
Beds
2
Baths
2,993
Sq Ft
$394/Sq Ft
Est. Value
About This Home
This home is located at 9 Maple St, Massapequa, NY 11758 and is currently estimated at $1,179,701, approximately $394 per square foot. 9 Maple St is a home located in Nassau County with nearby schools including Massapequa High School - Ames Campus, Berner Middle School, and Massapequa High School.
Ownership History
Date
Name
Owned For
Owner Type
Purchase Details
Closed on
Nov 19, 2014
Sold by
Rowley Uldine and Brodie Uldine
Bought by
1 C Home Inc
Current Estimated Value
Create a Home Valuation Report for This Property
The Home Valuation Report is an in-depth analysis detailing your home's value as well as a comparison with similar homes in the area
Home Values in the Area
Average Home Value in this Area
Purchase History
| Date | Buyer | Sale Price | Title Company |
|---|---|---|---|
| 1 C Home Inc | $350,000 | First American Title |
Source: Public Records
Tax History
| Year | Tax Paid | Tax Assessment Tax Assessment Total Assessment is a certain percentage of the fair market value that is determined by local assessors to be the total taxable value of land and additions on the property. | Land | Improvement |
|---|---|---|---|---|
| 2025 | $21,113 | $741 | $204 | $537 |
| 2024 | $6,384 | $743 | $205 | $538 |
Source: Public Records
Map
Nearby Homes
- 2125 North Dr
- 60 Cherry St
- 2097 Washington Ave
- 21 Chestnut St
- 54 Chestnut St
- 69 Hawthorne St
- 1967 Washington Ave
- 187 Massapequa Ave
- 32 Saint Marks Place
- 3861 Wilburne Ave
- 2162 Seamans Neck Rd
- 4460 Merrick Rd
- 3993 Fulton Ave
- 2191 Walsall St
- 2349 S Seamans Neck Rd
- 2309 Mattituck Ave
- 3933 Fulton Ave
- 2327 Mattituck Ave
- 63 Pennsylvania Ave
- 36 Michigan Ave
Your Personal Tour Guide
Ask me questions while you tour the home.