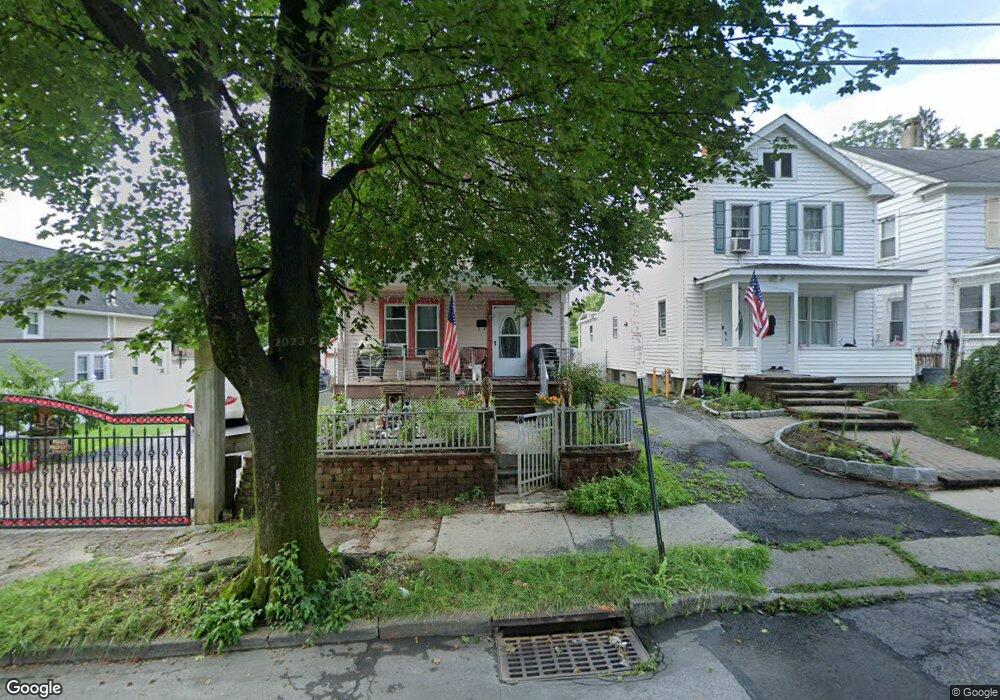
9 Maple St Newburgh, NY 12550
Estimated Value: $319,000 - $364,000
3
Beds
2
Baths
1,262
Sq Ft
$272/Sq Ft
Est. Value
About This Home
This home is located at 9 Maple St, Newburgh, NY 12550 and is currently estimated at $342,980, approximately $271 per square foot. 9 Maple St is a home located in Orange County with nearby schools including Newburgh Free Academy Main Campus, Bishop Dunn Memorial, and Little Harvard.
Ownership History
Date
Name
Owned For
Owner Type
Purchase Details
Closed on
May 16, 2018
Sold by
Rudek Lucille G
Bought by
Rodriguez Bernabe
Current Estimated Value
Purchase Details
Closed on
Apr 28, 2008
Sold by
Cardoso Vicente
Bought by
Post Rose
Purchase Details
Closed on
Mar 25, 2008
Sold by
Post Rose
Bought by
Post Rose
Purchase Details
Closed on
Dec 22, 2005
Sold by
Hemingway Mabel D and Hemingway Betty T. A
Bought by
Post Rose
Purchase Details
Closed on
Dec 20, 2000
Sold by
State Of New York Mtg Agency
Bought by
Roldan Jimmy A
Create a Home Valuation Report for This Property
The Home Valuation Report is an in-depth analysis detailing your home's value as well as a comparison with similar homes in the area
Home Values in the Area
Average Home Value in this Area
Purchase History
| Date | Buyer | Sale Price | Title Company |
|---|---|---|---|
| Rodriguez Bernabe | $50,000 | -- | |
| Post Rose | -- | Thomas Murphy | |
| Post Rose | -- | Thomas Murphy | |
| Post Rose | -- | Thomas J Murphy | |
| Post Rose | -- | Thomas J Murphy | |
| Post Rose | $233,000 | Victor Guzman | |
| Post Rose | $233,000 | Victor Guzman | |
| Roldan Jimmy A | $28,000 | -- | |
| Roldan Jimmy A | $28,000 | -- |
Source: Public Records
Tax History
| Year | Tax Paid | Tax Assessment Tax Assessment Total Assessment is a certain percentage of the fair market value that is determined by local assessors to be the total taxable value of land and additions on the property. | Land | Improvement |
|---|---|---|---|---|
| 2024 | $8,428 | $280,500 | $52,900 | $227,600 |
| 2023 | $8,428 | $255,000 | $52,900 | $202,100 |
| 2022 | $9,247 | $216,400 | $22,700 | $193,700 |
| 2021 | $8,411 | $180,300 | $20,600 | $159,700 |
| 2020 | $5,973 | $171,700 | $20,600 | $151,100 |
| 2019 | $2,949 | $125,600 | $20,600 | $105,000 |
| 2018 | $2,949 | $125,600 | $24,900 | $100,700 |
| 2017 | $5,412 | $125,600 | $24,900 | $100,700 |
| 2016 | $5,506 | $125,600 | $24,900 | $100,700 |
| 2015 | -- | $125,600 | $24,900 | $100,700 |
| 2014 | -- | $125,600 | $24,900 | $100,700 |
Source: Public Records
Map
Nearby Homes
Your Personal Tour Guide
Ask me questions while you tour the home.