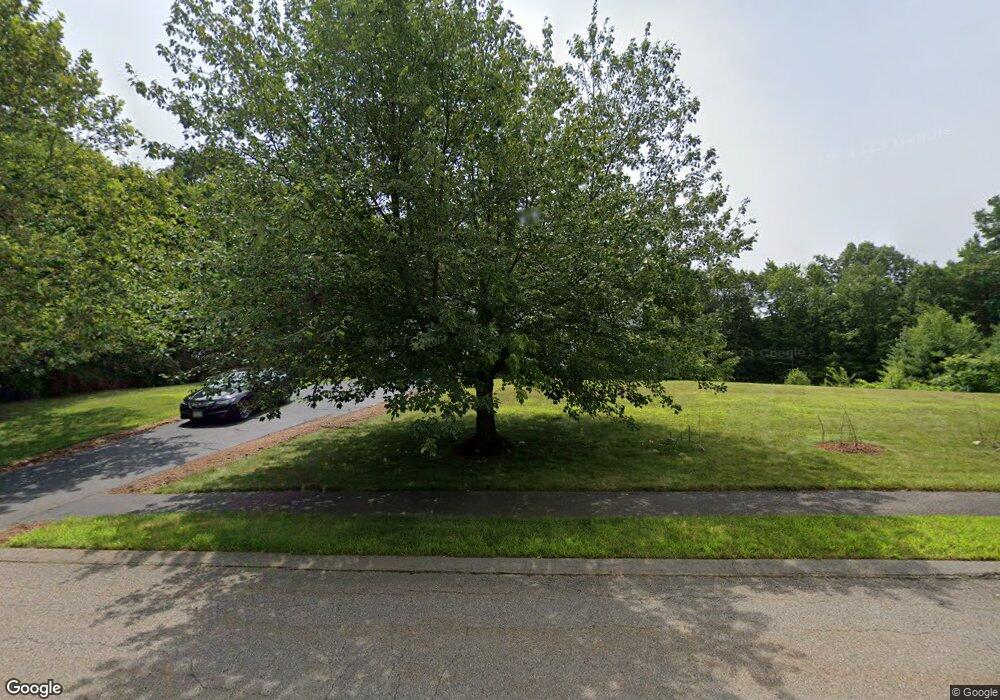
9 Maple Way Boylston, MA 01505
Estimated Value: $906,194 - $1,128,000
4
Beds
3
Baths
2,958
Sq Ft
$340/Sq Ft
Est. Value
About This Home
This home is located at 9 Maple Way, Boylston, MA 01505 and is currently estimated at $1,006,799, approximately $340 per square foot. 9 Maple Way is a home located in Worcester County with nearby schools including Tahanto Regional High School.
Ownership History
Date
Name
Owned For
Owner Type
Purchase Details
Closed on
Dec 29, 2008
Sold by
Singh Jasjit
Bought by
Kaur Amrit and Singh Jasjit
Current Estimated Value
Home Financials for this Owner
Home Financials are based on the most recent Mortgage that was taken out on this home.
Original Mortgage
$408,000
Interest Rate
6.17%
Mortgage Type
Purchase Money Mortgage
Purchase Details
Closed on
Jul 1, 2004
Sold by
Pulte Homes Of Ne Llc
Bought by
Singh Jasjit
Create a Home Valuation Report for This Property
The Home Valuation Report is an in-depth analysis detailing your home's value as well as a comparison with similar homes in the area
Home Values in the Area
Average Home Value in this Area
Purchase History
| Date | Buyer | Sale Price | Title Company |
|---|---|---|---|
| Kaur Amrit | -- | -- | |
| Kaur Amrit | -- | -- | |
| Singh Jasjit | $551,000 | -- | |
| Kaur Amrit | -- | -- | |
| Singh Jasjit | $551,000 | -- |
Source: Public Records
Mortgage History
| Date | Status | Borrower | Loan Amount |
|---|---|---|---|
| Open | Singh Jasjit | $402,000 | |
| Closed | Singh Jasjit | $408,000 | |
| Closed | Kaur Amrit | $408,000 |
Source: Public Records
Tax History
| Year | Tax Paid | Tax Assessment Tax Assessment Total Assessment is a certain percentage of the fair market value that is determined by local assessors to be the total taxable value of land and additions on the property. | Land | Improvement |
|---|---|---|---|---|
| 2025 | $11,783 | $852,000 | $225,900 | $626,100 |
| 2024 | $10,590 | $766,800 | $225,900 | $540,900 |
| 2023 | $10,030 | $696,500 | $198,300 | $498,200 |
| 2022 | $9,460 | $597,200 | $198,300 | $398,900 |
| 2021 | $3,779 | $587,700 | $198,300 | $389,400 |
| 2020 | $6,206 | $571,300 | $197,900 | $373,400 |
| 2019 | $8,862 | $552,500 | $196,300 | $356,200 |
| 2018 | $5,446 | $535,600 | $196,300 | $339,300 |
| 2017 | $8,634 | $535,600 | $196,300 | $339,300 |
| 2016 | $8,406 | $513,500 | $176,300 | $337,200 |
| 2015 | $8,940 | $513,500 | $176,300 | $337,200 |
| 2014 | $8,422 | $484,300 | $163,100 | $321,200 |
Source: Public Records
Map
Nearby Homes
- 15 Rocky Pond Rd
- 109 Rocky Pond Rd
- 505 Cross St
- 30 Bridle Path
- 52 Barnard Hill Rd
- 49 Barnard Hill Rd
- 7-11 Reservoir St
- 1 Harmony Ln Unit 4
- 15 Keyes House Rd
- 210 Green St
- 122 Green St
- 38 Keyes House Rd
- 1A Mentzer Ave
- 202 Brewer St
- 190 Mile Hill Rd
- 9 Morningside Dr
- 81 West St
- 245 Brewer St
- 24 Morningside Dr
- 217 Edgebrook Dr
Your Personal Tour Guide
Ask me questions while you tour the home.