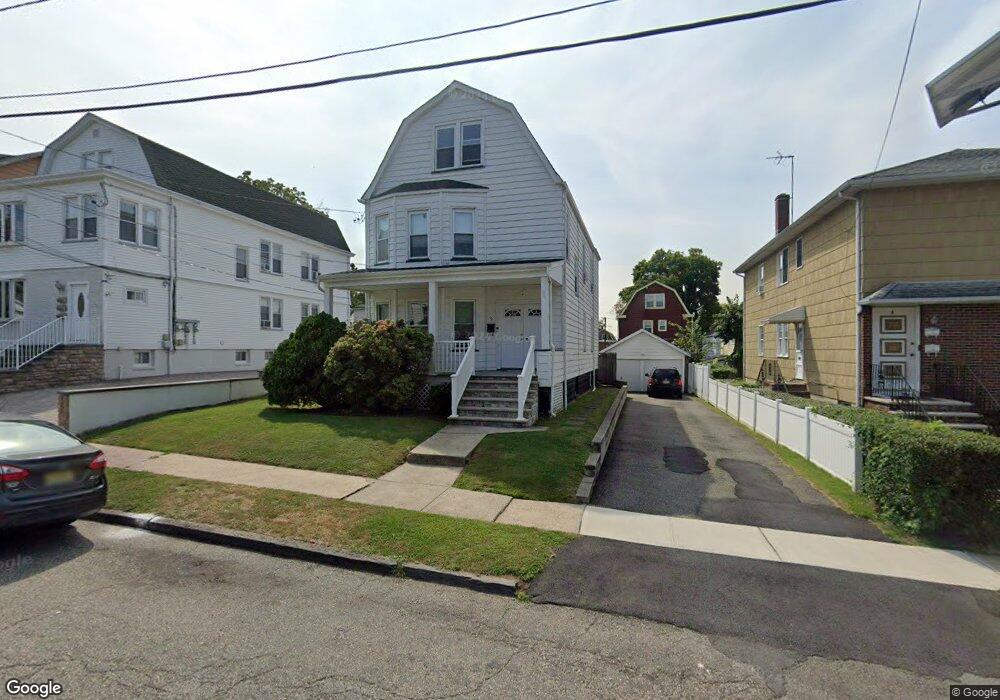
9 Marcy St Bloomfield, NJ 07003
Estimated Value: $694,610 - $838,000
Studio
--
Bath
2,886
Sq Ft
$267/Sq Ft
Est. Value
About This Home
This home is located at 9 Marcy St, Bloomfield, NJ 07003 and is currently estimated at $770,153, approximately $266 per square foot. 9 Marcy St is a home located in Essex County with nearby schools including Franklin School, Bloomfield Middle School, and Bloomfield High School.
Ownership History
Date
Name
Owned For
Owner Type
Purchase Details
Closed on
May 15, 2017
Sold by
Pedicinl Anthony J and Pedicinl Danlse M
Bought by
Pedicinl Anthony J and Pedicinl Danlse M
Current Estimated Value
Purchase Details
Closed on
Apr 8, 1997
Sold by
Glowacki Barbara
Bought by
Pedicini Anthony and Pedicini Denise
Home Financials for this Owner
Home Financials are based on the most recent Mortgage that was taken out on this home.
Original Mortgage
$24,000
Outstanding Balance
$3,092
Interest Rate
7.85%
Estimated Equity
$767,061
Create a Home Valuation Report for This Property
The Home Valuation Report is an in-depth analysis detailing your home's value as well as a comparison with similar homes in the area
Home Values in the Area
Average Home Value in this Area
Purchase History
| Date | Buyer | Sale Price | Title Company |
|---|---|---|---|
| Pedicinl Anthony J | -- | None Available | |
| Pedicini Anthony | $160,000 | -- |
Source: Public Records
Mortgage History
| Date | Status | Borrower | Loan Amount |
|---|---|---|---|
| Open | Pedicini Anthony | $24,000 |
Source: Public Records
Tax History
| Year | Tax Paid | Tax Assessment Tax Assessment Total Assessment is a certain percentage of the fair market value that is determined by local assessors to be the total taxable value of land and additions on the property. | Land | Improvement |
|---|---|---|---|---|
| 2025 | $15,023 | $459,700 | $112,700 | $347,000 |
| 2024 | $15,023 | $459,700 | $112,700 | $347,000 |
| 2022 | $14,720 | $459,700 | $112,700 | $347,000 |
| 2021 | $14,448 | $459,700 | $112,700 | $347,000 |
| 2020 | $14,228 | $459,700 | $112,700 | $347,000 |
| 2019 | $10,948 | $275,000 | $111,000 | $164,000 |
| 2018 | $10,901 | $275,000 | $111,000 | $164,000 |
| 2017 | $10,736 | $275,000 | $111,000 | $164,000 |
| 2016 | $10,615 | $275,000 | $111,000 | $164,000 |
| 2015 | $10,519 | $275,000 | $111,000 | $164,000 |
| 2014 | $10,326 | $275,000 | $111,000 | $164,000 |
Source: Public Records
Map
Nearby Homes
- 366 Hoover Ave Unit 119
- 378 Hoover Ave Unit 149
- 348 Hoover Ave Unit 92
- 10 E Passaic Ave
- 46 Summit Ave
- 290 Hoover Ave
- 290 Hoover Ave Unit 9
- 70 Valentine Rd
- 54 Broughton Ave
- 237 E Passaic Ave
- 10 Almira St Unit 14
- 10 14almira St
- 7 Maple St
- 124 Essex Ave
- 58 Osborne St
- 117 Hoover Ave
- 106 Broughton Ave
- 20 Elston St
- 129 Pake St
- 18 Birch St
- 5 Marcy St
- 13 Marcy St
- 13 Marcy St Unit 2
- 15 Marcy St
- 28 Beekman St
- 30 Beekman St
- 69 E Passaic Ave
- 69 E Passaic Ave Unit 69A
- 26 Beekman St
- 65 E Passaic Ave
- 36 Beekman St
- 79 E Passaic Ave
- 17 Marcy St
- 17 Marcy St Unit 2
- 20 Beekman St
- 38 Beekman St
- 18 Marcy St
- 18 Beekman St
- 19 Marcy St
- 85 E Passaic Ave
Your Personal Tour Guide
Ask me questions while you tour the home.