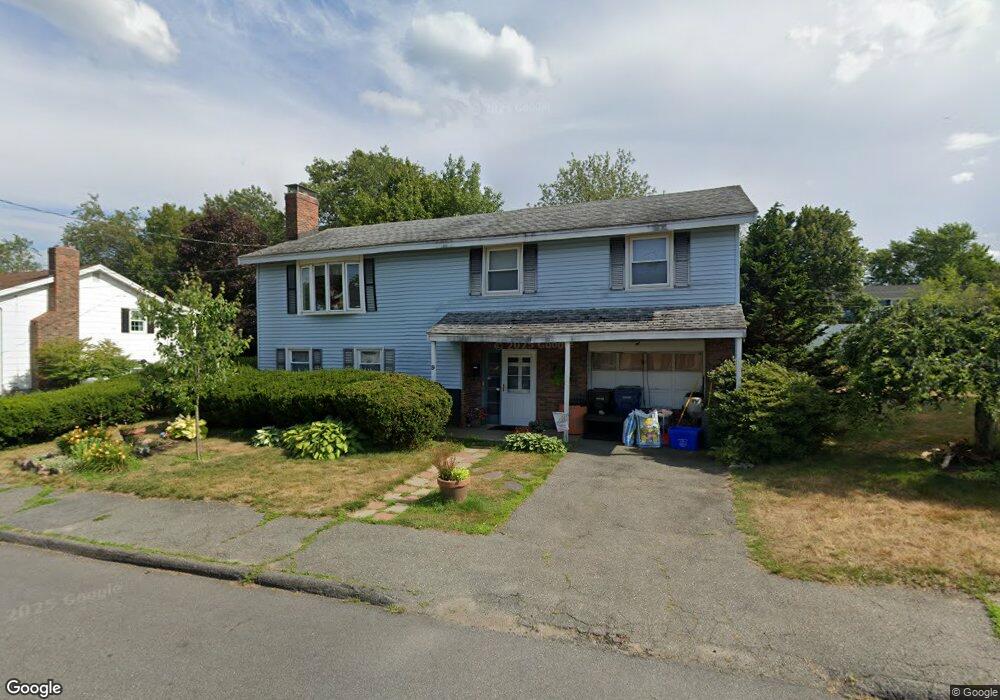
9 Marion Rd Salem, MA 01970
South Salem NeighborhoodEstimated Value: $672,223 - $712,000
3
Beds
2
Baths
1,629
Sq Ft
$422/Sq Ft
Est. Value
About This Home
This home is located at 9 Marion Rd, Salem, MA 01970 and is currently estimated at $687,556, approximately $422 per square foot. 9 Marion Rd is a home located in Essex County with nearby schools including Saltonstall School, Horace Mann Laboratory, and Witchcraft Heights Elementary School.
Ownership History
Date
Name
Owned For
Owner Type
Purchase Details
Closed on
Sep 26, 2003
Sold by
Hoang Hien Thuc and Hoang Nhan Kien
Bought by
Perkins-Gallo Nancy A
Current Estimated Value
Create a Home Valuation Report for This Property
The Home Valuation Report is an in-depth analysis detailing your home's value as well as a comparison with similar homes in the area
Home Values in the Area
Average Home Value in this Area
Purchase History
| Date | Buyer | Sale Price | Title Company |
|---|---|---|---|
| Perkins-Gallo Nancy A | $320,000 | -- |
Source: Public Records
Mortgage History
| Date | Status | Borrower | Loan Amount |
|---|---|---|---|
| Open | Perkins-Gallo Nancy A | $208,000 | |
| Closed | Perkins-Gallo Nancy A | $30,000 | |
| Closed | Perkins-Gallo Nancy A | $20,000 |
Source: Public Records
Tax History
| Year | Tax Paid | Tax Assessment Tax Assessment Total Assessment is a certain percentage of the fair market value that is determined by local assessors to be the total taxable value of land and additions on the property. | Land | Improvement |
|---|---|---|---|---|
| 2025 | $6,503 | $573,500 | $224,300 | $349,200 |
| 2024 | $6,246 | $537,500 | $211,700 | $325,800 |
| 2023 | $6,025 | $481,600 | $192,700 | $288,900 |
| 2022 | $5,921 | $446,900 | $176,900 | $270,000 |
| 2021 | $5,644 | $409,000 | $164,300 | $244,700 |
| 2020 | $5,956 | $412,200 | $161,100 | $251,100 |
| 2019 | $5,933 | $392,900 | $151,700 | $241,200 |
| 2018 | $5,557 | $361,300 | $141,600 | $219,700 |
| 2017 | $5,316 | $335,200 | $132,700 | $202,500 |
| 2016 | $5,253 | $335,200 | $132,700 | $202,500 |
| 2015 | $4,989 | $304,000 | $116,900 | $187,100 |
Source: Public Records
Map
Nearby Homes
- 23 Marion Rd Unit B
- 34 Moffatt Rd
- 28 Surrey Rd
- 106 Broadway Unit 3
- 263 Jefferson Ave
- 6 Arthur St Unit 3
- 29 Willson St
- 58 Willson St
- 24 Wisteria St Unit 2
- 3 Cedarcrest Rd
- 6 Loring Hills Ave Unit D3
- 29 Ocean Ave Unit 4
- 10 Hazel St Unit 2
- 11 Angenica Terrace
- 4 Willow Ave Unit 2
- 119 Highland Ave
- 49 Weatherly Dr
- 11 Weatherly Dr
- 35 First St Unit A
- 8 Old Salem Rd