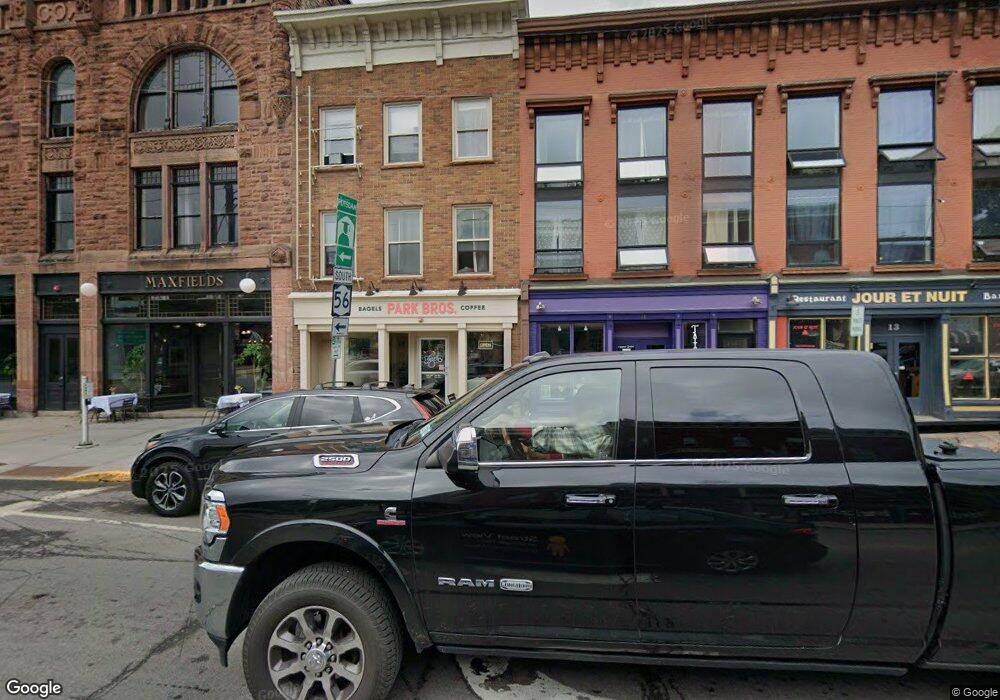
9 Market St Potsdam, NY 13676
Estimated Value: $286,455
2
Beds
--
Bath
1,600
Sq Ft
$179/Sq Ft
Est. Value
About This Home
Semester and summer rentals available
Security deposit is $400.
Trash, water, and sewer is included.
Tenant pays heat and any other utilities such as internet and electric.
The heat is electric.
Ownership History
Date
Name
Owned For
Owner Type
Purchase Details
Closed on
Jun 23, 2009
Sold by
Hewitson G. Lionel
Bought by
Farrago Inc
Current Estimated Value
Purchase Details
Closed on
Jan 22, 2009
Sold by
Hewitson G
Bought by
Farrago Inc
Purchase Details
Closed on
Dec 1, 2003
Sold by
Higley Builders Inc
Bought by
Hewitson G. Lionel
Purchase Details
Closed on
Oct 1, 1999
Sold by
Hawitson G Lionel and Hawitson Jean
Bought by
Higley Builders Inc
Create a Home Valuation Report for This Property
The Home Valuation Report is an in-depth analysis detailing your home's value as well as a comparison with similar homes in the area
Home Values in the Area
Average Home Value in this Area
Purchase History
| Date | Buyer | Sale Price | Title Company |
|---|---|---|---|
| Farrago Inc | -- | J Collins | |
| Farrago Inc | $155,000 | J Collins | |
| Hewitson G. Lionel | $15,000 | Andrew W. Silver | |
| Higley Builders Inc | $160,000 | Andrew Silver |
Source: Public Records
Property History
| Date | Event | Price | List to Sale | Price per Sq Ft |
|---|---|---|---|---|
| 07/17/2025 07/17/25 | Off Market | $600 | -- | -- |
| 05/05/2025 05/05/25 | Price Changed | $600 | +9.1% | $1 / Sq Ft |
| 01/07/2025 01/07/25 | Price Changed | $550 | -8.3% | $1 / Sq Ft |
| 12/10/2024 12/10/24 | For Rent | $600 | 0.0% | -- |
| 05/23/2024 05/23/24 | Price Changed | $600 | +9.1% | $1 / Sq Ft |
| 04/18/2024 04/18/24 | Price Changed | $550 | -8.3% | $1 / Sq Ft |
| 04/18/2024 04/18/24 | Price Changed | $600 | 0.0% | $1 / Sq Ft |
| 04/18/2024 04/18/24 | For Rent | $600 | -2.4% | -- |
| 08/07/2023 08/07/23 | For Rent | $615 | 0.0% | -- |
| 06/21/2023 06/21/23 | For Rent | $615 | 0.0% | -- |
| 05/26/2023 05/26/23 | For Rent | $615 | -- | -- |
Tax History Compared to Growth
Tax History
| Year | Tax Paid | Tax Assessment Tax Assessment Total Assessment is a certain percentage of the fair market value that is determined by local assessors to be the total taxable value of land and additions on the property. | Land | Improvement |
|---|---|---|---|---|
| 2024 | $9,262 | $155,000 | $8,800 | $146,200 |
| 2023 | $9,082 | $155,000 | $8,800 | $146,200 |
| 2022 | $8,919 | $155,000 | $8,800 | $146,200 |
| 2021 | $8,801 | $155,000 | $8,800 | $146,200 |
| 2020 | $8,718 | $155,000 | $8,800 | $146,200 |
| 2019 | $8,543 | $155,000 | $8,800 | $146,200 |
| 2018 | $8,543 | $155,000 | $8,800 | $146,200 |
| 2017 | $8,335 | $155,000 | $8,800 | $146,200 |
| 2016 | $8,183 | $155,000 | $8,800 | $146,200 |
| 2015 | -- | $155,000 | $8,800 | $146,200 |
| 2014 | -- | $155,000 | $8,800 | $146,200 |
Source: Public Records
Map
Nearby Homes
