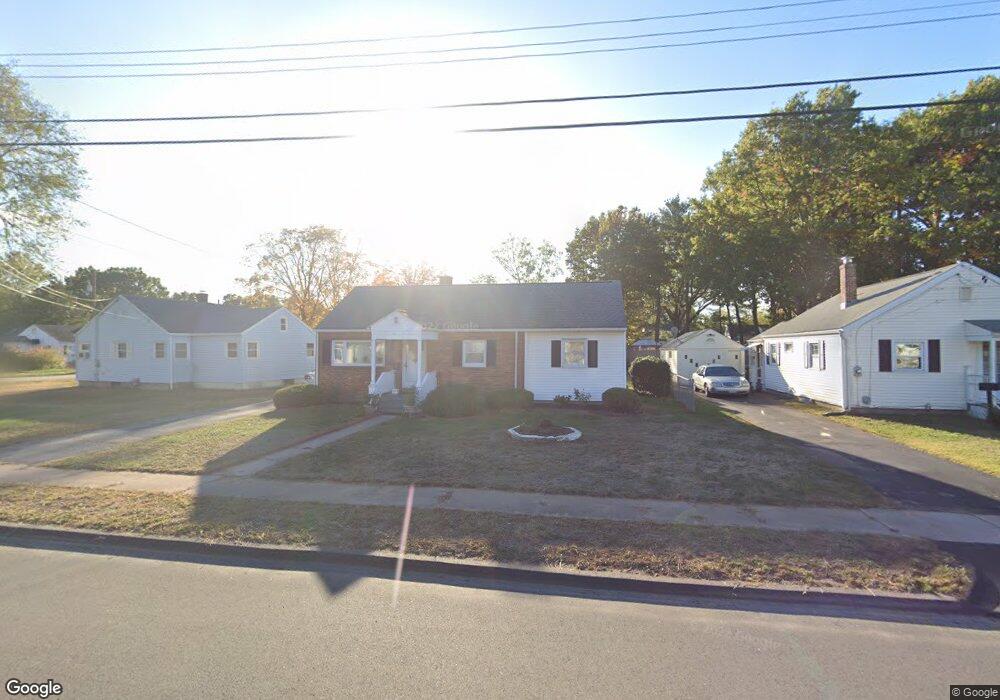
9 Martin Cir East Hartford, CT 06118
Estimated Value: $238,000 - $280,000
2
Beds
2
Baths
1,137
Sq Ft
$235/Sq Ft
Est. Value
About This Home
This home is located at 9 Martin Cir, East Hartford, CT 06118 and is currently estimated at $267,712, approximately $235 per square foot. 9 Martin Cir is a home located in Hartford County with nearby schools including East Hartford Middle School, East Hartford High School, and Grace Academy Hartford.
Ownership History
Date
Name
Owned For
Owner Type
Purchase Details
Closed on
Jul 24, 2006
Sold by
Sklat Kathleen and Vanvoorst Andrea
Bought by
Navarro Elcira
Current Estimated Value
Home Financials for this Owner
Home Financials are based on the most recent Mortgage that was taken out on this home.
Original Mortgage
$133,600
Interest Rate
6.67%
Create a Home Valuation Report for This Property
The Home Valuation Report is an in-depth analysis detailing your home's value as well as a comparison with similar homes in the area
Home Values in the Area
Average Home Value in this Area
Purchase History
| Date | Buyer | Sale Price | Title Company |
|---|---|---|---|
| Navarro Elcira | $167,000 | -- |
Source: Public Records
Mortgage History
| Date | Status | Borrower | Loan Amount |
|---|---|---|---|
| Open | Navarro Elcira | $175,500 | |
| Closed | Navarro Elcira | $133,600 | |
| Closed | Navarro Elcira | $33,400 |
Source: Public Records
Tax History Compared to Growth
Tax History
| Year | Tax Paid | Tax Assessment Tax Assessment Total Assessment is a certain percentage of the fair market value that is determined by local assessors to be the total taxable value of land and additions on the property. | Land | Improvement |
|---|---|---|---|---|
| 2025 | $6,089 | $132,650 | $35,600 | $97,050 |
| 2024 | $5,837 | $132,650 | $35,600 | $97,050 |
| 2023 | $5,643 | $132,650 | $35,600 | $97,050 |
| 2022 | $5,439 | $132,650 | $35,600 | $97,050 |
| 2021 | $4,769 | $96,630 | $25,390 | $71,240 |
| 2020 | $4,824 | $96,630 | $25,390 | $71,240 |
| 2019 | $4,745 | $96,630 | $25,390 | $71,240 |
| 2018 | $4,605 | $96,630 | $25,390 | $71,240 |
| 2017 | $4,546 | $96,630 | $25,390 | $71,240 |
| 2016 | $4,028 | $87,840 | $22,210 | $65,630 |
| 2015 | $4,028 | $87,840 | $22,210 | $65,630 |
| 2014 | $3,988 | $87,840 | $22,210 | $65,630 |
Source: Public Records
Map
Nearby Homes
- 16 Whitney St
- 24 Whiting Rd
- 67 Sisson St Unit 69
- 642 Silver Ln
- 61 Central Ave Unit 63
- 41 Bissell St
- 47 Elm St
- 85R Olmsted St
- 98 Olmsted St
- 62 Wells Ave
- 50 Garvan St
- 30 Oakwood St
- 10 Kenyon Place
- 181 Burnside Ave
- 52 Burnside Ave
- 265 Burnside Ave
- 59 Tolland St
- 31 High St Unit 8204
- 88 Governor St Unit 90
- 11 Westbrook St