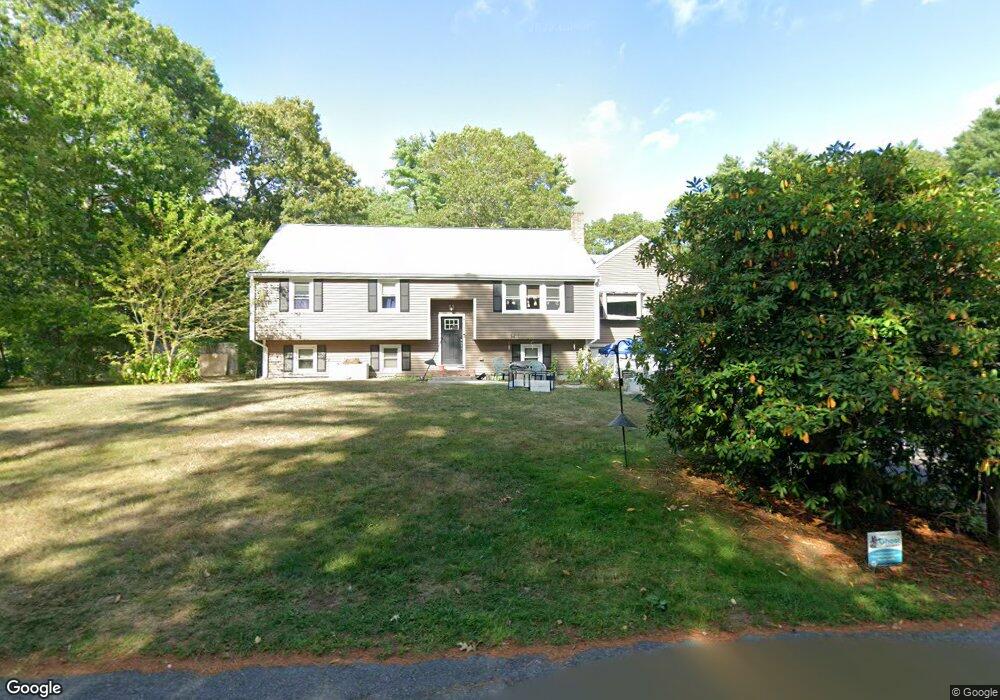
9 Mazzilli Dr Carver, MA 02330
Estimated Value: $634,241 - $759,000
4
Beds
3
Baths
1,886
Sq Ft
$373/Sq Ft
Est. Value
About This Home
This home is located at 9 Mazzilli Dr, Carver, MA 02330 and is currently estimated at $703,810, approximately $373 per square foot. 9 Mazzilli Dr is a home located in Plymouth County with nearby schools including Carver Elementary School, Carver Middle/High School, and Map Academy Charter School.
Ownership History
Date
Name
Owned For
Owner Type
Purchase Details
Closed on
May 7, 2020
Sold by
Mancillas Risa M
Bought by
Mancillas Risa M and Mancillas Jason M
Current Estimated Value
Purchase Details
Closed on
May 28, 2010
Sold by
Giorgio Antonio A and Giorgio Patricia
Bought by
Mancillas Risa M
Home Financials for this Owner
Home Financials are based on the most recent Mortgage that was taken out on this home.
Original Mortgage
$298,973
Interest Rate
5.5%
Mortgage Type
FHA
Create a Home Valuation Report for This Property
The Home Valuation Report is an in-depth analysis detailing your home's value as well as a comparison with similar homes in the area
Home Values in the Area
Average Home Value in this Area
Purchase History
| Date | Buyer | Sale Price | Title Company |
|---|---|---|---|
| Mancillas Risa M | -- | None Available | |
| Mancillas Risa M | $303,000 | -- |
Source: Public Records
Mortgage History
| Date | Status | Borrower | Loan Amount |
|---|---|---|---|
| Previous Owner | Mancillas Risa M | $298,973 |
Source: Public Records
Tax History
| Year | Tax Paid | Tax Assessment Tax Assessment Total Assessment is a certain percentage of the fair market value that is determined by local assessors to be the total taxable value of land and additions on the property. | Land | Improvement |
|---|---|---|---|---|
| 2025 | $7,728 | $557,200 | $135,600 | $421,600 |
| 2024 | $7,632 | $538,600 | $132,900 | $405,700 |
| 2023 | $7,318 | $501,600 | $132,900 | $368,700 |
| 2022 | $6,918 | $432,900 | $113,700 | $319,200 |
| 2021 | $6,669 | $393,700 | $101,500 | $292,200 |
| 2020 | $6,360 | $370,000 | $94,900 | $275,100 |
| 2019 | $6,140 | $360,100 | $92,100 | $268,000 |
| 2018 | $5,947 | $337,300 | $92,100 | $245,200 |
| 2017 | $5,691 | $321,700 | $88,600 | $233,100 |
| 2016 | $5,048 | $296,400 | $84,400 | $212,000 |
| 2015 | $4,940 | $290,400 | $84,400 | $206,000 |
| 2014 | $4,744 | $278,900 | $106,700 | $172,200 |
Source: Public Records
Map
Nearby Homes
- 81 Center St
- 89 Silva St
- 35 Silva St
- 13 Pond View Way
- 56 Bunnys Rd
- 43 S Meadow Rd
- 67 Crystal Lake Dr
- 235 Main St
- 11 Brockton Ave
- 7 Cedar Dr
- 6 Twin Pines Ln Unit 6
- 48 S Meadow Village
- 29 S Meadow Village
- 55 S Meadow Village
- 6 Susan Cir
- 26 Santana Way Unit 26
- 40 Fosdick Rd
- 1 Pinehurst Dr
- 6 Coachman Terrace
- 6 Deer Hill Ln
Your Personal Tour Guide
Ask me questions while you tour the home.