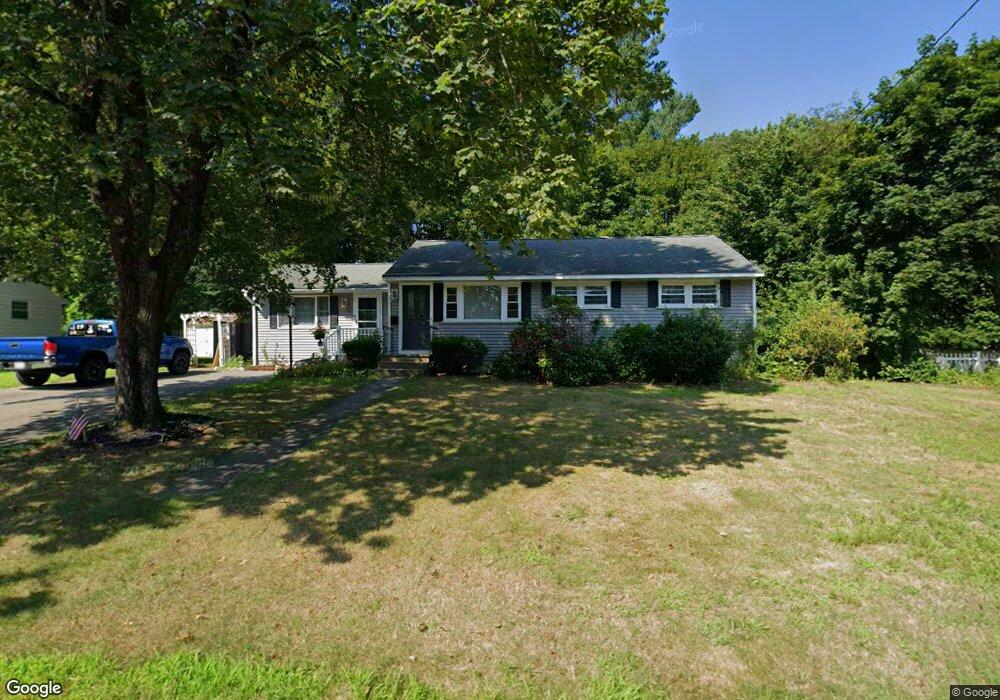
9 Mcfarlin Rd Chelmsford, MA 01824
Golden Triangle NeighborhoodEstimated Value: $519,000 - $592,000
2
Beds
1
Bath
1,184
Sq Ft
$471/Sq Ft
Est. Value
About This Home
This home is located at 9 Mcfarlin Rd, Chelmsford, MA 01824 and is currently estimated at $557,784, approximately $471 per square foot. 9 Mcfarlin Rd is a home located in Middlesex County with nearby schools including Center Elementary School, McCarthy Middle School, and Chelmsford High School.
Ownership History
Date
Name
Owned For
Owner Type
Purchase Details
Closed on
May 20, 2002
Sold by
Dussault Tanya T
Bought by
Black Brenda
Current Estimated Value
Home Financials for this Owner
Home Financials are based on the most recent Mortgage that was taken out on this home.
Original Mortgage
$183,000
Interest Rate
7.15%
Mortgage Type
Purchase Money Mortgage
Purchase Details
Closed on
Dec 30, 1997
Sold by
Monson Douglas E
Bought by
Tacelli Tanya S
Purchase Details
Closed on
May 25, 1993
Sold by
Widen Norman E
Bought by
Monson Douglas E
Create a Home Valuation Report for This Property
The Home Valuation Report is an in-depth analysis detailing your home's value as well as a comparison with similar homes in the area
Home Values in the Area
Average Home Value in this Area
Purchase History
| Date | Buyer | Sale Price | Title Company |
|---|---|---|---|
| Black Brenda | $233,000 | -- | |
| Black Brenda | $233,000 | -- | |
| Tacelli Tanya S | $134,900 | -- | |
| Tacelli Tanya S | $134,900 | -- | |
| Monson Douglas E | $101,000 | -- | |
| Monson Douglas E | $101,000 | -- |
Source: Public Records
Mortgage History
| Date | Status | Borrower | Loan Amount |
|---|---|---|---|
| Open | Monson Douglas E | $233,000 | |
| Closed | Monson Douglas E | $183,000 |
Source: Public Records
Tax History Compared to Growth
Tax History
| Year | Tax Paid | Tax Assessment Tax Assessment Total Assessment is a certain percentage of the fair market value that is determined by local assessors to be the total taxable value of land and additions on the property. | Land | Improvement |
|---|---|---|---|---|
| 2025 | $6,105 | $439,200 | $259,100 | $180,100 |
| 2024 | $6,090 | $447,100 | $259,100 | $188,000 |
| 2023 | $6,040 | $420,300 | $278,500 | $141,800 |
| 2022 | $5,937 | $376,500 | $242,200 | $134,300 |
| 2021 | $5,426 | $344,700 | $224,300 | $120,400 |
| 2020 | $5,090 | $309,400 | $201,100 | $108,300 |
| 2019 | $4,930 | $301,500 | $199,100 | $102,400 |
| 2018 | $5,013 | $279,100 | $179,300 | $99,800 |
| 2017 | $4,675 | $260,900 | $167,900 | $93,000 |
| 2016 | $4,336 | $240,500 | $160,900 | $79,600 |
| 2015 | $4,103 | $219,400 | $140,800 | $78,600 |
| 2014 | $4,048 | $213,300 | $138,000 | $75,300 |
Source: Public Records
Map
Nearby Homes
- 243 Riverneck Rd
- 11 Dawn Dr
- 215 Chelmsford St Unit 18
- 34 Manning Rd
- 1 Sunset Ave
- 24 Shedd Ln
- 33 Dunstan Rd
- 52 Bigelow St
- 32 Robert Bigelow St
- 20 Woodland Dr Unit 304
- 20 Woodland Dr Unit 316
- 122 Swan St Unit 102
- 10 Brook St
- 26 Sprague Ave
- 53 Gorham St
- 117 Gorham St
- 21 Twiss St
- 6-8 Brick Kiln Rd
- 106 Gorham St
- 41 Devine Ave