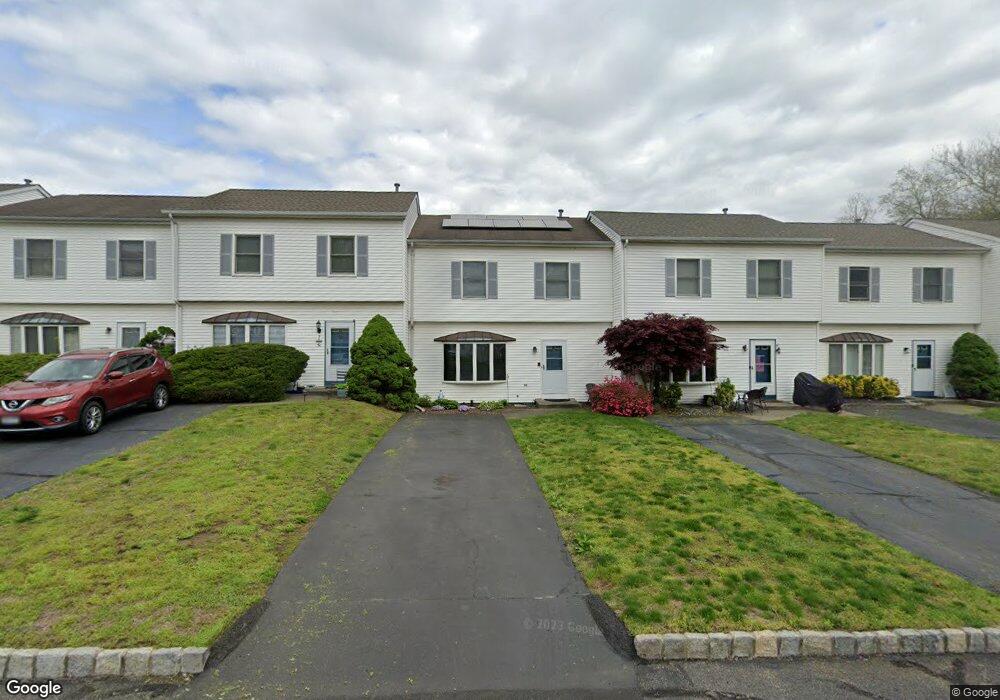
9 Melucci Ct West Haverstraw, NY 10993
Estimated Value: $419,000 - $465,000
3
Beds
3
Baths
1,350
Sq Ft
$327/Sq Ft
Est. Value
About This Home
This home is located at 9 Melucci Ct, West Haverstraw, NY 10993 and is currently estimated at $441,326, approximately $326 per square foot. 9 Melucci Ct is a home located in Rockland County with nearby schools including West Haverstraw Elementary School, Haverstraw Elementary School, and Fieldstone Secondary School.
Ownership History
Date
Name
Owned For
Owner Type
Purchase Details
Closed on
Jan 1, 2004
Sold by
Kim Sun Yol
Bought by
Kim Chae Chun and Kim Kyu C
Current Estimated Value
Purchase Details
Closed on
Jan 7, 2002
Sold by
Dufresne Maria
Bought by
Lowry Michael J and Dufresne Nathalie C
Home Financials for this Owner
Home Financials are based on the most recent Mortgage that was taken out on this home.
Original Mortgage
$203,150
Interest Rate
6.5%
Purchase Details
Closed on
Mar 29, 2000
Sold by
Dalton Richard H and Dalton Christine M
Bought by
Dufresne Maria
Home Financials for this Owner
Home Financials are based on the most recent Mortgage that was taken out on this home.
Original Mortgage
$97,000
Interest Rate
8.3%
Create a Home Valuation Report for This Property
The Home Valuation Report is an in-depth analysis detailing your home's value as well as a comparison with similar homes in the area
Home Values in the Area
Average Home Value in this Area
Purchase History
| Date | Buyer | Sale Price | Title Company |
|---|---|---|---|
| Kim Chae Chun | -- | Diamond Title Agency Llc | |
| Lowry Michael J | $239,000 | Fidelity National Title Ins | |
| Dufresne Maria | $148,000 | National Granite Title Insur |
Source: Public Records
Mortgage History
| Date | Status | Borrower | Loan Amount |
|---|---|---|---|
| Previous Owner | Lowry Michael J | $203,150 | |
| Previous Owner | Dufresne Maria | $97,000 |
Source: Public Records
Tax History Compared to Growth
Tax History
| Year | Tax Paid | Tax Assessment Tax Assessment Total Assessment is a certain percentage of the fair market value that is determined by local assessors to be the total taxable value of land and additions on the property. | Land | Improvement |
|---|---|---|---|---|
| 2024 | $15,032 | $214,000 | $71,325 | $142,675 |
| 2023 | $15,032 | $214,000 | $71,325 | $142,675 |
| 2022 | $16,332 | $214,000 | $71,325 | $142,675 |
| 2021 | $16,255 | $234,000 | $71,325 | $162,675 |
| 2020 | $10,772 | $234,000 | $71,325 | $162,675 |
| 2019 | $2,490 | $244,000 | $71,325 | $172,675 |
| 2018 | $10,790 | $244,000 | $71,325 | $172,675 |
| 2017 | $10,099 | $244,000 | $71,325 | $172,675 |
| 2016 | $10,108 | $244,000 | $71,325 | $172,675 |
| 2015 | -- | $244,000 | $71,325 | $172,675 |
| 2014 | -- | $244,000 | $71,325 | $172,675 |
Source: Public Records
Map
Nearby Homes
- 167 Coolidge St
- 22 Ferracane Place
- 43 Zugibe Ct
- 160 Halgren Crescent
- 12 Hillside Ave
- 80 Kennedy Dr
- 25 Wayne Ave
- 13 Overlook Rd
- 33 Overlook Rd
- 33 Peck St
- 31 Farley Dr
- 16 Demarest Ave
- 33 Muntz Ln
- 3 N Wayne Ave
- 5 Peck St
- 7 N Wayne Ave
- 34 Roosevelt Dr
- 10 Kwiecinski St
- 84 Village Mill Unit 84
- 165 Gurnee Ave