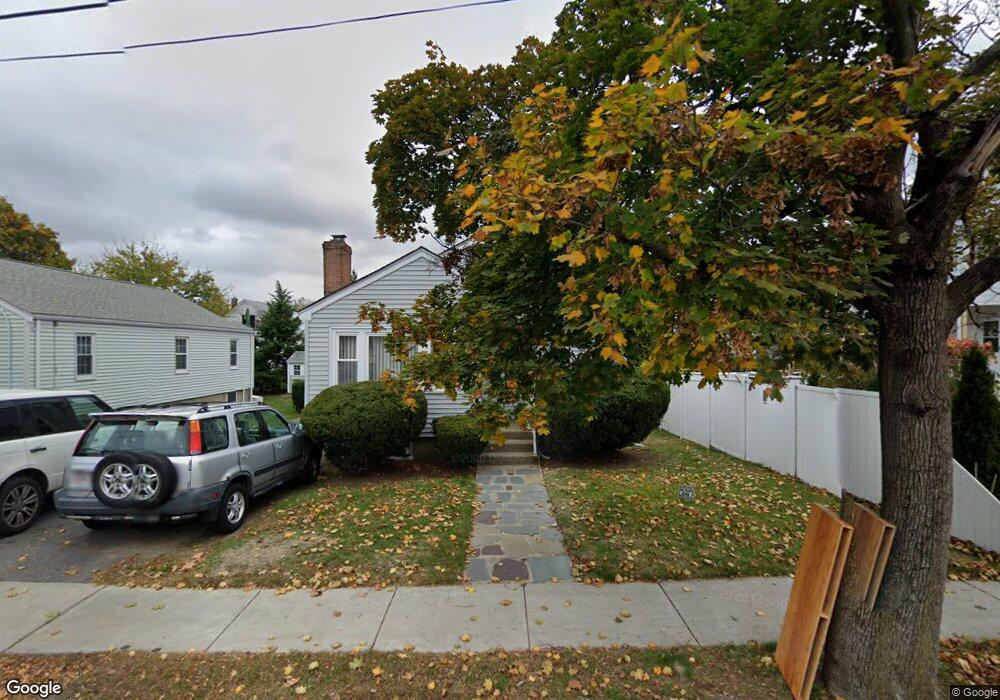
9 Merrifield Ave Watertown, MA 02472
East Watertown NeighborhoodEstimated Value: $452,000 - $839,000
3
Beds
1
Bath
936
Sq Ft
$746/Sq Ft
Est. Value
About This Home
This home is located at 9 Merrifield Ave, Watertown, MA 02472 and is currently estimated at $698,424, approximately $746 per square foot. 9 Merrifield Ave is a home located in Middlesex County with nearby schools including Atrium School, St. Stephen's Armenian Elementary School, and Shady Hill School.
Ownership History
Date
Name
Owned For
Owner Type
Purchase Details
Closed on
Jun 30, 2025
Sold by
Hagopian Paula
Bought by
Paula Hagopian T and Paula Hagopian
Current Estimated Value
Purchase Details
Closed on
Jul 7, 2022
Sold by
Jones Anita H
Bought by
Hagopian Cesar and Hagopian Paula
Home Financials for this Owner
Home Financials are based on the most recent Mortgage that was taken out on this home.
Original Mortgage
$465,000
Interest Rate
5.1%
Mortgage Type
Purchase Money Mortgage
Purchase Details
Closed on
Jun 24, 2021
Sold by
Hagopian Shake M and Jones Anita H
Bought by
Hagopian Cesar and Hagopian Paula
Purchase Details
Closed on
Aug 8, 2018
Sold by
Marcom & Sons Llc
Bought by
Hagopian Shake M and Jones Anita H
Home Financials for this Owner
Home Financials are based on the most recent Mortgage that was taken out on this home.
Original Mortgage
$156,000
Interest Rate
4.6%
Mortgage Type
New Conventional
Purchase Details
Closed on
Jul 26, 2018
Sold by
Hagopian Shake M
Bought by
Marcom & Son Llc
Home Financials for this Owner
Home Financials are based on the most recent Mortgage that was taken out on this home.
Original Mortgage
$156,000
Interest Rate
4.6%
Mortgage Type
New Conventional
Purchase Details
Closed on
Dec 22, 2000
Sold by
Beurklian Harry and Beurklian Hermine
Bought by
Hagopian Vahram H and Hagopian Shake M
Create a Home Valuation Report for This Property
The Home Valuation Report is an in-depth analysis detailing your home's value as well as a comparison with similar homes in the area
Home Values in the Area
Average Home Value in this Area
Purchase History
| Date | Buyer | Sale Price | Title Company |
|---|---|---|---|
| Paula Hagopian T | -- | -- | |
| Paula Hagopian T | -- | -- | |
| Hagopian Paula | -- | -- | |
| Hagopian Paula | -- | -- | |
| Hagopian Cesar | $320,000 | None Available | |
| Hagopian Cesar | $320,000 | None Available | |
| Hagopian Cesar | $320,000 | None Available | |
| Hagopian Cesar | -- | None Available | |
| Hagopian Cesar | -- | None Available | |
| Hagopian Cesar | -- | None Available | |
| Hagopian Shake M | -- | -- | |
| Hagopian Shake M | -- | -- | |
| Hagopian Shake M | -- | -- | |
| Marcom & Son Llc | -- | -- | |
| Marcom & Son Llc | -- | -- | |
| Marcom & Son Llc | -- | -- | |
| Hagopian Vahram H | $260,000 | -- |
Source: Public Records
Mortgage History
| Date | Status | Borrower | Loan Amount |
|---|---|---|---|
| Previous Owner | Hagopian Cesar | $465,000 | |
| Previous Owner | Marcom & Son Llc | $156,000 | |
| Previous Owner | Hagopian Vahram H | $208,000 |
Source: Public Records
Tax History Compared to Growth
Tax History
| Year | Tax Paid | Tax Assessment Tax Assessment Total Assessment is a certain percentage of the fair market value that is determined by local assessors to be the total taxable value of land and additions on the property. | Land | Improvement |
|---|---|---|---|---|
| 2025 | $7,528 | $644,500 | $468,300 | $176,200 |
| 2024 | $6,642 | $567,700 | $441,300 | $126,400 |
| 2023 | $7,480 | $550,800 | $427,100 | $123,700 |
| 2022 | $6,569 | $495,800 | $384,400 | $111,400 |
| 2021 | $5,987 | $488,700 | $377,300 | $111,400 |
| 2020 | $5,759 | $474,400 | $363,000 | $111,400 |
| 2019 | $5,632 | $437,300 | $348,800 | $88,500 |
| 2018 | $5,307 | $394,000 | $309,600 | $84,400 |
| 2017 | $5,230 | $376,500 | $309,600 | $66,900 |
| 2016 | $4,594 | $335,800 | $277,600 | $58,200 |
| 2015 | $4,834 | $321,600 | $263,400 | $58,200 |
| 2014 | $4,811 | $321,600 | $263,400 | $58,200 |
Source: Public Records
Map
Nearby Homes
- 238 Arlington St Unit 238
- 43 Irma Ave Unit 43
- 1 Clayton St
- 87 Templeton Pkwy Unit 3
- 25 Francis St Unit 2
- 25 Francis St Unit 1
- 56-58 Edgecliff Rd
- 85 Dexter Ave Unit 87
- 85 Dexter Ave
- 163 Belmont St
- 57 Quimby St
- 16 Ericsson St
- 81 Winsor Ave
- 133 Hillside Rd
- 10 Marlboro St Unit 1
- 154 Cypress St
- 30 Unity Ave Unit 30
- 66 Holworthy St
- 276 Belmont St Unit 1
- 87 Holworthy St Unit 2
- 13 Merrifield Ave
- 230 Arlington St
- 236 Arlington St
- 234 Arlington St
- 236 Arlington St Unit 1
- 234 Arlington St Unit 2
- 236 Arlington St Unit 236
- 17 Merrifield Ave
- 10 Wells Ave
- 238 Arlington St
- 240 Arlington St
- 240 Arlington St Unit 240-1
- 14 Wells Ave
- 16 Wells Ave
- 224 Arlington St Unit 1
- 224 Arlington St
- 224 Arlington St Unit 224
- 10 Merrifield Ave
- 21 Merrifield Ave
- 242 Arlington St