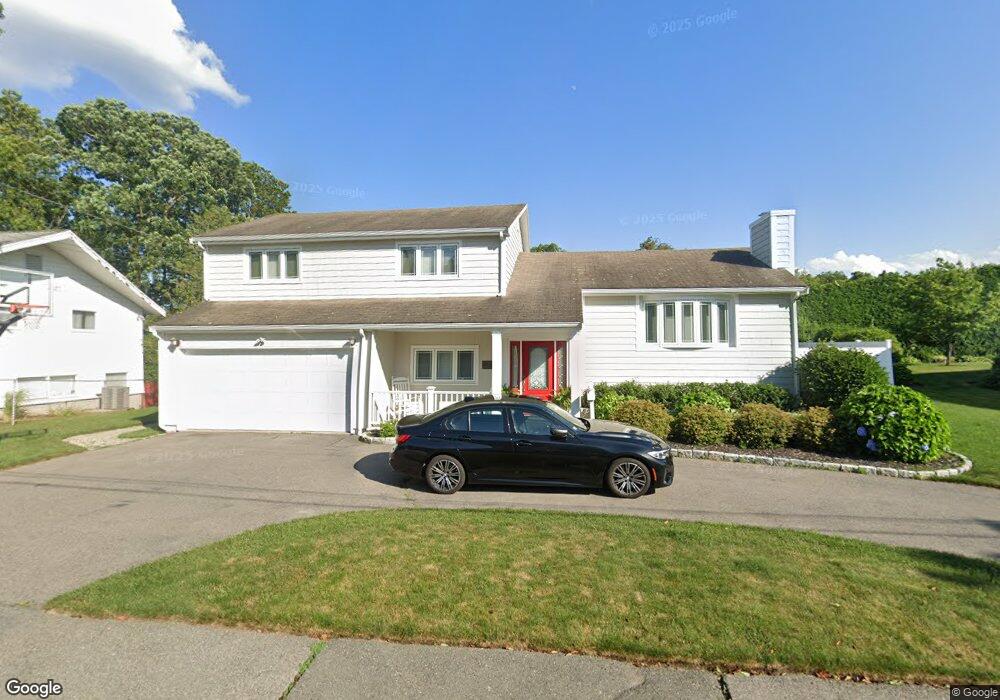
9 Merrymount Dr Swampscott, MA 01907
Estimated Value: $846,963 - $1,106,000
3
Beds
3
Baths
2,579
Sq Ft
$372/Sq Ft
Est. Value
About This Home
This home is located at 9 Merrymount Dr, Swampscott, MA 01907 and is currently estimated at $958,491, approximately $371 per square foot. 9 Merrymount Dr is a home located in Essex County with nearby schools including Swampscott Middle School and Swampscott High School.
Ownership History
Date
Name
Owned For
Owner Type
Purchase Details
Closed on
Aug 31, 1989
Sold by
Shuman Melvin R
Bought by
Collier William M
Current Estimated Value
Home Financials for this Owner
Home Financials are based on the most recent Mortgage that was taken out on this home.
Original Mortgage
$157,500
Interest Rate
9.7%
Mortgage Type
Purchase Money Mortgage
Create a Home Valuation Report for This Property
The Home Valuation Report is an in-depth analysis detailing your home's value as well as a comparison with similar homes in the area
Home Values in the Area
Average Home Value in this Area
Purchase History
| Date | Buyer | Sale Price | Title Company |
|---|---|---|---|
| Collier William M | $242,300 | -- |
Source: Public Records
Mortgage History
| Date | Status | Borrower | Loan Amount |
|---|---|---|---|
| Open | Collier William M | $30,000 | |
| Closed | Collier William M | $157,500 | |
| Previous Owner | Collier William M | $83,000 |
Source: Public Records
Tax History
| Year | Tax Paid | Tax Assessment Tax Assessment Total Assessment is a certain percentage of the fair market value that is determined by local assessors to be the total taxable value of land and additions on the property. | Land | Improvement |
|---|---|---|---|---|
| 2025 | $7,987 | $696,300 | $336,800 | $359,500 |
| 2024 | $8,164 | $710,500 | $321,700 | $388,800 |
| 2023 | $7,349 | $626,000 | $301,600 | $324,400 |
| 2022 | $6,829 | $532,300 | $251,300 | $281,000 |
| 2021 | $6,766 | $490,300 | $226,200 | $264,100 |
| 2020 | $7,011 | $490,300 | $226,200 | $264,100 |
| 2019 | $7,147 | $470,200 | $206,100 | $264,100 |
| 2018 | $7,445 | $465,300 | $206,100 | $259,200 |
| 2017 | $7,418 | $425,100 | $181,000 | $244,100 |
| 2016 | $6,807 | $392,800 | $165,900 | $226,900 |
| 2015 | $6,737 | $392,800 | $165,900 | $226,900 |
| 2014 | $6,382 | $341,300 | $140,700 | $200,600 |
Source: Public Records
Map
Nearby Homes
- 3 Didio Dr
- 50 Mountwood Rd
- 51 Mountwood Rd
- 445 Essex St Unit 304
- 441 Essex St Unit 302
- 178 Norfolk Ave
- 64 Stetson Ave
- 71 Walnut Rd
- 46 Stetson Ave
- 1004 Paradise Rd Unit 1L
- 1 Bond St
- 1002 Paradise Rd Unit PHE
- 106 Norfolk Ave
- 49 Weatherly Dr
- 30 Weatherly Dr
- 11 Weatherly Dr
- 80 Norfolk Ave Unit 1
- 75 Bay View Dr
- 10 Arbutus Rd
- 49 Blaney St
Your Personal Tour Guide
Ask me questions while you tour the home.