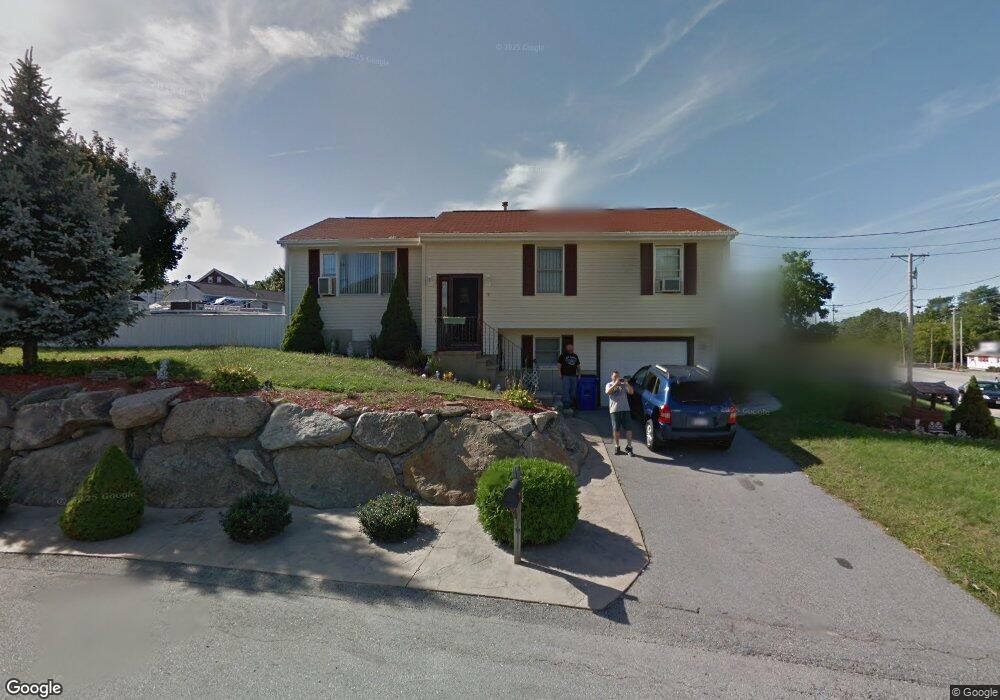
9 Michael St Fall River, MA 02721
Niagara NeighborhoodEstimated Value: $463,000 - $515,000
5
Beds
2
Baths
1,800
Sq Ft
$270/Sq Ft
Est. Value
About This Home
This home is located at 9 Michael St, Fall River, MA 02721 and is currently estimated at $486,767, approximately $270 per square foot. 9 Michael St is a home located in Bristol County with nearby schools including William S Greene, Talbot Innovation School, and B M C Durfee High School.
Ownership History
Date
Name
Owned For
Owner Type
Purchase Details
Closed on
Oct 16, 2019
Sold by
Keezer Ann M and Rutkowski David
Bought by
Rutkowski David
Current Estimated Value
Purchase Details
Closed on
May 18, 1998
Sold by
Family Homes Constr Co
Bought by
Keezer John S and Keezer Ann Marie
Create a Home Valuation Report for This Property
The Home Valuation Report is an in-depth analysis detailing your home's value as well as a comparison with similar homes in the area
Home Values in the Area
Average Home Value in this Area
Purchase History
| Date | Buyer | Sale Price | Title Company |
|---|---|---|---|
| Rutkowski David | -- | -- | |
| Keezer John S | $115,000 | -- |
Source: Public Records
Mortgage History
| Date | Status | Borrower | Loan Amount |
|---|---|---|---|
| Previous Owner | Keezer John S | $162,000 | |
| Previous Owner | Keezer John S | $157,500 | |
| Previous Owner | Keezer John S | $35,000 | |
| Previous Owner | Keezer John S | $106,000 |
Source: Public Records
Tax History
| Year | Tax Paid | Tax Assessment Tax Assessment Total Assessment is a certain percentage of the fair market value that is determined by local assessors to be the total taxable value of land and additions on the property. | Land | Improvement |
|---|---|---|---|---|
| 2025 | $5,102 | $445,600 | $105,800 | $339,800 |
| 2024 | $4,516 | $393,000 | $98,700 | $294,300 |
| 2023 | $4,321 | $352,200 | $82,900 | $269,300 |
| 2022 | $3,463 | $274,400 | $78,900 | $195,500 |
| 2021 | $3,456 | $249,900 | $75,500 | $174,400 |
| 2020 | $3,432 | $237,500 | $73,000 | $164,500 |
| 2019 | $3,463 | $237,500 | $73,000 | $164,500 |
| 2018 | $3,316 | $226,800 | $77,400 | $149,400 |
| 2017 | $3,104 | $221,700 | $77,400 | $144,300 |
| 2016 | $3,035 | $222,700 | $94,700 | $128,000 |
| 2015 | $2,908 | $222,300 | $91,000 | $131,300 |
| 2014 | $2,924 | $232,400 | $101,100 | $131,300 |
Source: Public Records
Map
Nearby Homes
- 1 Lawrence St Unit 1
- 000 Lawrence St
- 1-11 Lawrence St
- 472 Buffinton St (Ns)
- 364 Tecumseh St
- 188-194 Nashua St
- 472 Buffinton St
- 20 Reeves St
- 132 Lonsdale St
- 582 Cambridge St
- 847 Pleasant St
- 405 Warren St
- 304 Cambridge St
- 94 Snell St
- 118 Jefferson St
- 1350 Rodman St
- 120 Jefferson St
- 1155-1157 Pleasant St
- 11 Foster St
- 25 Lebanon St Unit D
- 155 Lewiston St
- 14 Michael St
- 17 Michael St
- 868 Rodman St
- 0 Michael St
- 840 Rodman St
- 854 Rodman St
- 22-24 Michael St
- 22 Michael St Unit 24
- 22 Michael St
- 22 Michael St Unit 22
- 870 Rodman St Unit 870
- 24 Michael St
- 27 Michael St
- 56 Michael St
- 880 Rodman St
- 41 Michael St
- 58 Michael St
- 58 Michael St Unit 58
- 886 Rodman St
Your Personal Tour Guide
Ask me questions while you tour the home.