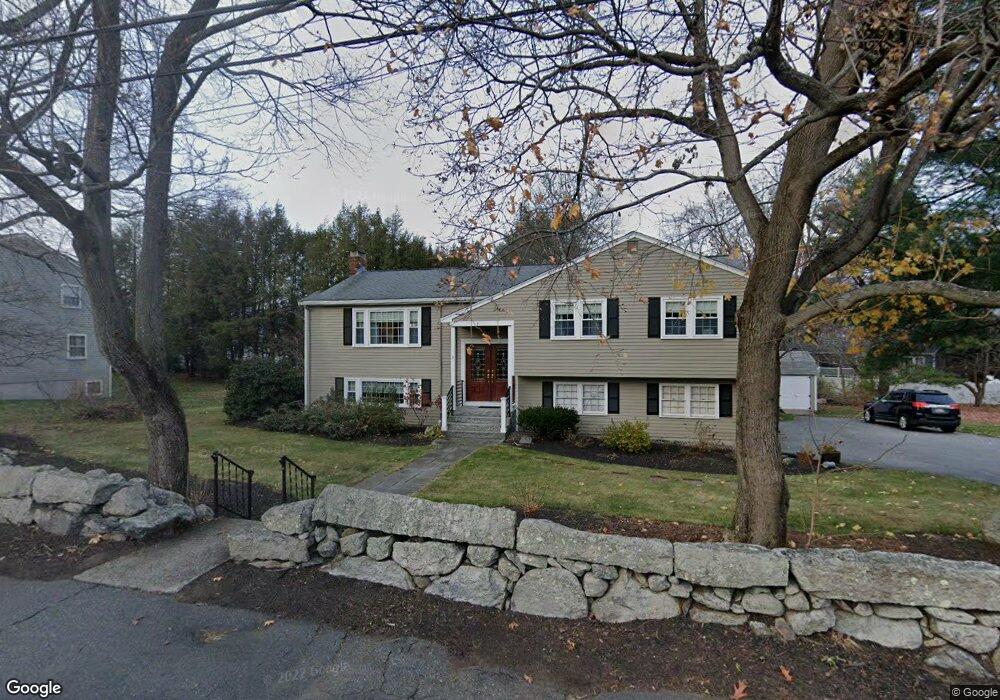
9 Middle St Lexington, MA 02421
Idylwilde NeighborhoodEstimated Value: $1,581,000 - $1,952,000
5
Beds
3
Baths
2,800
Sq Ft
$616/Sq Ft
Est. Value
About This Home
This home is located at 9 Middle St, Lexington, MA 02421 and is currently estimated at $1,724,833, approximately $616 per square foot. 9 Middle St is a home located in Middlesex County with nearby schools including Bridge Elementary School, Jonas Clarke Middle School, and Lexington High School.
Ownership History
Date
Name
Owned For
Owner Type
Purchase Details
Closed on
Mar 1, 2019
Sold by
Buckley William A and Buckley Carol A
Bought by
Kingsbury Scott A and Buckley-Kingsbury Susan M
Current Estimated Value
Purchase Details
Closed on
Aug 15, 2005
Sold by
Chan Deanna W and Chan Sherman F
Bought by
Buckley Carol A and Kingsbury Scott A
Home Financials for this Owner
Home Financials are based on the most recent Mortgage that was taken out on this home.
Original Mortgage
$215,000
Interest Rate
5.54%
Mortgage Type
Purchase Money Mortgage
Purchase Details
Closed on
Apr 27, 1993
Sold by
Rzedzian Richard P and Rzedzian Jane
Bought by
Chan Deanna W and Chan Sherman F
Home Financials for this Owner
Home Financials are based on the most recent Mortgage that was taken out on this home.
Original Mortgage
$202,000
Interest Rate
7.45%
Mortgage Type
Purchase Money Mortgage
Create a Home Valuation Report for This Property
The Home Valuation Report is an in-depth analysis detailing your home's value as well as a comparison with similar homes in the area
Home Values in the Area
Average Home Value in this Area
Purchase History
| Date | Buyer | Sale Price | Title Company |
|---|---|---|---|
| Kingsbury Scott A | -- | -- | |
| Buckley Carol A | $815,000 | -- | |
| Chan Deanna W | $332,700 | -- |
Source: Public Records
Mortgage History
| Date | Status | Borrower | Loan Amount |
|---|---|---|---|
| Previous Owner | Buckley Carol A | $215,000 | |
| Previous Owner | Chan Deanna W | $178,165 | |
| Previous Owner | Chan Deanna W | $202,000 |
Source: Public Records
Tax History
| Year | Tax Paid | Tax Assessment Tax Assessment Total Assessment is a certain percentage of the fair market value that is determined by local assessors to be the total taxable value of land and additions on the property. | Land | Improvement |
|---|---|---|---|---|
| 2025 | $17,305 | $1,415,000 | $732,000 | $683,000 |
| 2024 | $16,611 | $1,356,000 | $697,000 | $659,000 |
| 2023 | $15,704 | $1,208,000 | $634,000 | $574,000 |
| 2022 | $14,863 | $1,077,000 | $576,000 | $501,000 |
| 2021 | $15,311 | $1,064,000 | $549,000 | $515,000 |
| 2020 | $14,542 | $1,035,000 | $549,000 | $486,000 |
| 2019 | $13,696 | $970,000 | $523,000 | $447,000 |
| 2018 | $13,013 | $910,000 | $487,000 | $423,000 |
| 2017 | $12,824 | $885,000 | $450,000 | $435,000 |
| 2016 | $12,060 | $826,000 | $428,000 | $398,000 |
| 2015 | $11,041 | $743,000 | $389,000 | $354,000 |
| 2014 | $10,919 | $704,000 | $346,000 | $358,000 |
Source: Public Records
Map
Nearby Homes
- 8 Phinney Rd
- 22 Fairbanks Rd
- 94 Middle St
- 5 Leroy Rd
- 8 Common Ct
- 8 Common Ct Unit 8
- 671 Marrett Rd
- 18 Common Ct Unit 18
- 19 Deering Ave
- 2 Effie Place
- 24 Deering Ave
- 17 Prospect Hill Rd
- 72 Grassland St
- 16 Estabrook Rd
- 367 Waltham St Unit 5
- 2380 Massachusetts Ave
- 18 Baskin Rd
- 6 Revolutionary Rd
- 3 Effie Place
- 167 Lexington Rd N
Your Personal Tour Guide
Ask me questions while you tour the home.