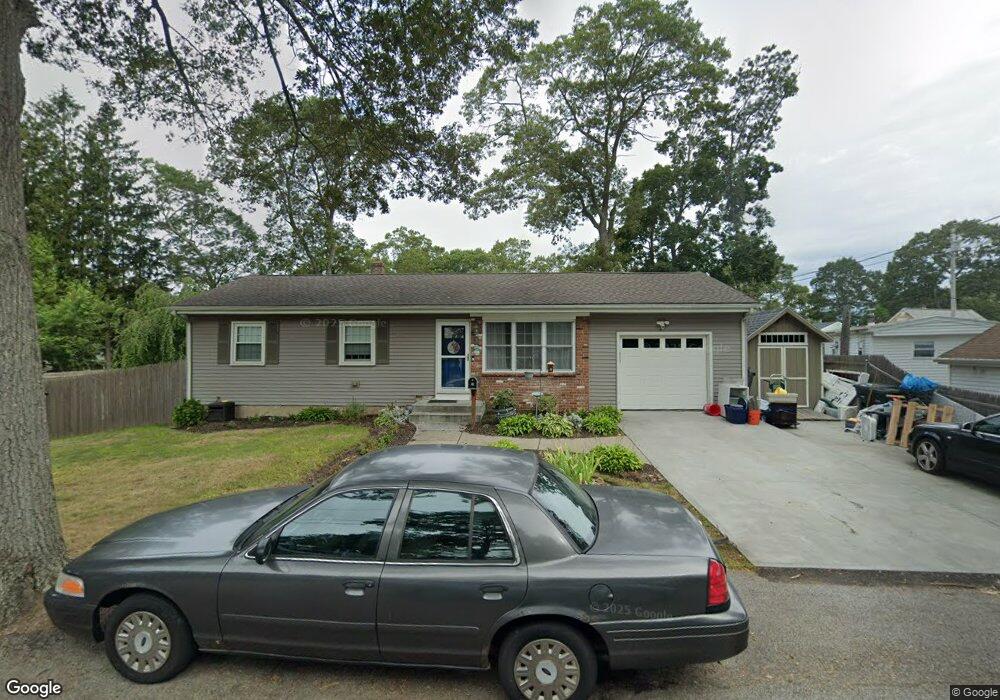
9 Mohawk St Coventry, RI 02816
Estimated Value: $349,000 - $374,000
3
Beds
1
Bath
912
Sq Ft
$401/Sq Ft
Est. Value
About This Home
This home is located at 9 Mohawk St, Coventry, RI 02816 and is currently estimated at $365,838, approximately $401 per square foot. 9 Mohawk St is a home located in Kent County with nearby schools including Alan Shawn Feinstein Ms Of Cov, Coventry High School, and Father John V. Doyle School.
Ownership History
Date
Name
Owned For
Owner Type
Purchase Details
Closed on
Dec 27, 2001
Sold by
Schwab Gene R and Schwab Aimee L
Bought by
Piccirilli Joseph and Piccirilli Lisa
Current Estimated Value
Home Financials for this Owner
Home Financials are based on the most recent Mortgage that was taken out on this home.
Original Mortgage
$135,399
Interest Rate
6.61%
Purchase Details
Closed on
Feb 12, 1998
Sold by
Est Boelens Theodore and Smith Joan P
Bought by
Schwab Gene R
Create a Home Valuation Report for This Property
The Home Valuation Report is an in-depth analysis detailing your home's value as well as a comparison with similar homes in the area
Purchase History
| Date | Buyer | Sale Price | Title Company |
|---|---|---|---|
| Piccirilli Joseph | $136,500 | -- | |
| Schwab Gene R | $95,000 | -- |
Source: Public Records
Mortgage History
| Date | Status | Borrower | Loan Amount |
|---|---|---|---|
| Open | Schwab Gene R | $203,245 | |
| Closed | Schwab Gene R | $103,939 | |
| Closed | Schwab Gene R | $7,750 | |
| Closed | Schwab Gene R | $135,399 |
Source: Public Records
Tax History
| Year | Tax Paid | Tax Assessment Tax Assessment Total Assessment is a certain percentage of the fair market value that is determined by local assessors to be the total taxable value of land and additions on the property. | Land | Improvement |
|---|---|---|---|---|
| 2025 | $4,245 | $263,800 | $109,100 | $154,700 |
| 2024 | $4,180 | $263,900 | $109,100 | $154,800 |
| 2023 | $4,046 | $263,900 | $109,100 | $154,800 |
| 2022 | $3,930 | $200,800 | $103,400 | $97,400 |
| 2021 | $3,896 | $200,800 | $103,400 | $97,400 |
| 2020 | $4,466 | $200,800 | $103,400 | $97,400 |
| 2019 | $3,714 | $167,000 | $81,600 | $85,400 |
| 2018 | $3,609 | $167,000 | $81,600 | $85,400 |
| 2017 | $3,504 | $167,000 | $81,600 | $85,400 |
| 2016 | $3,102 | $144,900 | $65,400 | $79,500 |
| 2015 | $3,018 | $144,900 | $65,400 | $79,500 |
| 2014 | $2,955 | $144,900 | $65,400 | $79,500 |
| 2013 | $2,928 | $156,900 | $70,800 | $86,100 |
Source: Public Records
Map
Nearby Homes
- 22 Rawlinson Dr
- 21 Darton St
- 275 E Shore Dr
- 251 E Shore Dr
- 1 Pettine St
- 11 Kennedy Dr
- 22 Colorado St
- 20 Pine Way Blvd
- 19 Pine Way Blvd
- 311 Arnold Rd
- 45 Pine Ave Unit 36
- 91 Windsor Park Dr
- 10 Colonial Rd
- 0 New London Turnpike
- 4 York Dr
- 9 Holmes Rd
- 27 Matteson St
- 32 Pilgrim Ave
- 19 Turner Dr
- 86 Wood St
Your Personal Tour Guide
Ask me questions while you tour the home.