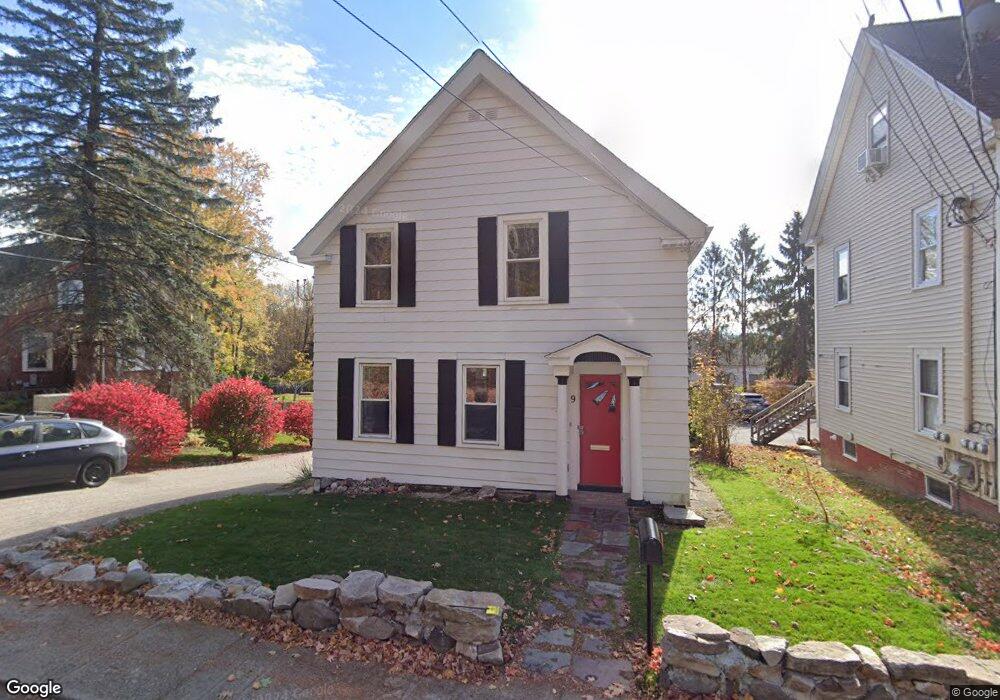
9 Monroe St Unit 1 Amesbury, MA 01913
Estimated Value: $558,000 - $580,000
3
Beds
1
Bath
1,300
Sq Ft
$439/Sq Ft
Est. Value
About This Home
This home is located at 9 Monroe St Unit 1, Amesbury, MA 01913 and is currently estimated at $570,249, approximately $438 per square foot. 9 Monroe St Unit 1 is a home located in Essex County with nearby schools including Amesbury High School and Amesbury Seventh-Day Adventist School.
Ownership History
Date
Name
Owned For
Owner Type
Purchase Details
Closed on
Jun 30, 2025
Sold by
Mccowen Carl and Mccowen Clare
Bought by
Carter Lindsay
Current Estimated Value
Purchase Details
Closed on
Feb 14, 2022
Sold by
Genest Andre J
Bought by
Mccowen Carl and Mccowen Clare
Home Financials for this Owner
Home Financials are based on the most recent Mortgage that was taken out on this home.
Original Mortgage
$304,000
Interest Rate
3.56%
Mortgage Type
Purchase Money Mortgage
Purchase Details
Closed on
Oct 17, 2003
Sold by
Genest Andre J and Genest Joseph R
Bought by
Genest Andre J
Purchase Details
Closed on
Dec 29, 1995
Sold by
Sands Rt
Bought by
Genest Andre J and Genest Joseph
Create a Home Valuation Report for This Property
The Home Valuation Report is an in-depth analysis detailing your home's value as well as a comparison with similar homes in the area
Home Values in the Area
Average Home Value in this Area
Purchase History
| Date | Buyer | Sale Price | Title Company |
|---|---|---|---|
| Carter Lindsay | $573,000 | -- | |
| Carter Lindsay | $573,000 | -- | |
| Mccowen Carl | $380,000 | None Available | |
| Mccowen Carl | $380,000 | None Available | |
| Genest Andre J | -- | -- | |
| Genest Andre J | -- | -- | |
| Genest Andre J | $120,000 | -- | |
| Genest Andre J | $120,000 | -- |
Source: Public Records
Mortgage History
| Date | Status | Borrower | Loan Amount |
|---|---|---|---|
| Previous Owner | Mccowen Carl | $304,000 | |
| Previous Owner | Genest Andre J | $241,427 | |
| Previous Owner | Genest Andre J | $258,000 |
Source: Public Records
Tax History Compared to Growth
Tax History
| Year | Tax Paid | Tax Assessment Tax Assessment Total Assessment is a certain percentage of the fair market value that is determined by local assessors to be the total taxable value of land and additions on the property. | Land | Improvement |
|---|---|---|---|---|
| 2025 | $7,459 | $487,500 | $211,600 | $275,900 |
| 2024 | $7,063 | $451,600 | $199,600 | $252,000 |
| 2023 | $6,809 | $416,700 | $173,500 | $243,200 |
| 2022 | $6,289 | $355,500 | $150,900 | $204,600 |
| 2021 | $6,039 | $330,900 | $116,500 | $214,400 |
| 2020 | $5,432 | $316,200 | $112,100 | $204,100 |
| 2019 | $5,461 | $297,300 | $112,100 | $185,200 |
| 2018 | $5,291 | $278,600 | $106,800 | $171,800 |
| 2017 | $5,137 | $257,500 | $106,800 | $150,700 |
| 2016 | $5,129 | $252,900 | $106,800 | $146,100 |
| 2015 | $5,047 | $245,700 | $106,800 | $138,900 |
| 2014 | $4,890 | $233,200 | $106,800 | $126,400 |
Source: Public Records
Map
Nearby Homes
- 204 Elm St
- 179 Elm St
- 15 Atlantic Ave
- 161 Elm St Unit A
- 22 Huntington Ave
- 7 Melrose St
- 47 Macy St
- 45 Macy St Unit 302C
- 97 Elm St
- 5 Richs Ct Unit 3
- 43 Aubin St Unit 1
- 24 Aubin St Unit 2
- 434 Main St
- 435 Main St
- 53 Market St
- 25 Cedar St Unit 4
- 25 Cedar St Unit 7
- 394 Main St
- 2 Birchwood Ct Unit 101
- 17 Linwood Place