9 N Doe Dr Temple, GA 30179
Abilene NeighborhoodEstimated Value: $343,526 - $434,000
4
Beds
3
Baths
3,234
Sq Ft
$118/Sq Ft
Est. Value
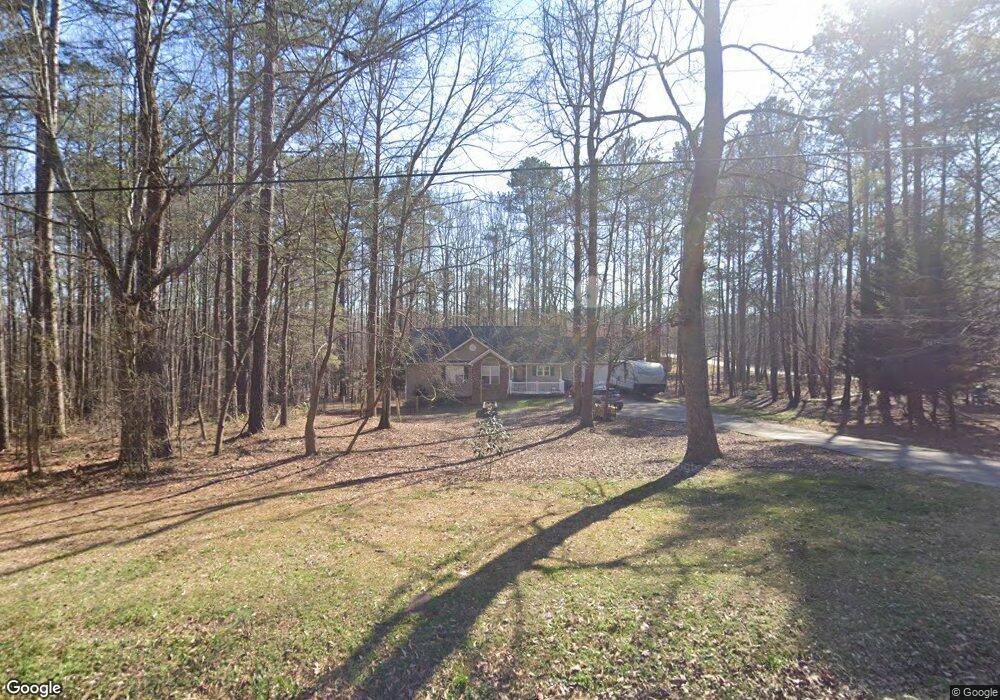
About This Home
This home is located at 9 N Doe Dr, Temple, GA 30179 and is currently estimated at $383,132, approximately $118 per square foot. 9 N Doe Dr is a home located in Carroll County with nearby schools including Sharp Creek Elementary School, Temple Middle School, and Temple High School.
Ownership History
Date
Name
Owned For
Owner Type
Purchase Details
Closed on
Feb 11, 2011
Sold by
Federal National Mortgage Association
Bought by
Woodward Thomas W
Current Estimated Value
Home Financials for this Owner
Home Financials are based on the most recent Mortgage that was taken out on this home.
Original Mortgage
$82,416
Outstanding Balance
$55,900
Interest Rate
4.75%
Mortgage Type
FHA
Estimated Equity
$327,232
Purchase Details
Closed on
Dec 7, 2010
Sold by
Suntrust Mortgage Inc
Bought by
Federal National Mortgage Asc
Purchase Details
Closed on
Apr 25, 2007
Sold by
Kuykendoll Michael A
Bought by
Lee Tracy
Home Financials for this Owner
Home Financials are based on the most recent Mortgage that was taken out on this home.
Original Mortgage
$120,320
Interest Rate
6.11%
Mortgage Type
New Conventional
Purchase Details
Closed on
Feb 14, 2001
Sold by
Spivey Donnie and Spivey Sher
Bought by
Kuykendoll Michael A and Kuykendoll Kimberly D
Purchase Details
Closed on
Mar 29, 1996
Bought by
Spivey Donnie and Spivey Sher
Create a Home Valuation Report for This Property
The Home Valuation Report is an in-depth analysis detailing your home's value as well as a comparison with similar homes in the area
Home Values in the Area
Average Home Value in this Area
Purchase History
| Date | Buyer | Sale Price | Title Company |
|---|---|---|---|
| Woodward Thomas W | $89,500 | -- | |
| Federal National Mortgage Asc | $132,500 | -- | |
| Lee Tracy | $150,400 | -- | |
| Kuykendoll Michael A | $169,900 | -- | |
| Spivey Donnie | -- | -- |
Source: Public Records
Mortgage History
| Date | Status | Borrower | Loan Amount |
|---|---|---|---|
| Open | Woodward Thomas W | $82,416 | |
| Previous Owner | Lee Tracy | $120,320 | |
| Previous Owner | Lee Tracy | $0 |
Source: Public Records
Tax History
| Year | Tax Paid | Tax Assessment Tax Assessment Total Assessment is a certain percentage of the fair market value that is determined by local assessors to be the total taxable value of land and additions on the property. | Land | Improvement |
|---|---|---|---|---|
| 2025 | $2,030 | $113,396 | $8,000 | $105,396 |
| 2024 | $2,053 | $113,396 | $8,000 | $105,396 |
| 2023 | $2,053 | $104,503 | $8,000 | $96,503 |
| 2022 | $1,752 | $85,383 | $8,000 | $77,383 |
| 2021 | $1,595 | $74,283 | $8,000 | $66,283 |
| 2020 | $1,393 | $63,020 | $8,000 | $55,020 |
| 2019 | $1,334 | $59,221 | $8,000 | $51,221 |
| 2018 | $1,396 | $61,747 | $8,000 | $53,747 |
| 2017 | $1,400 | $61,747 | $8,000 | $53,747 |
| 2016 | $1,400 | $61,747 | $8,000 | $53,747 |
| 2015 | $1,208 | $47,186 | $8,000 | $39,186 |
| 2014 | $1,213 | $47,186 | $8,000 | $39,186 |
Source: Public Records
Map
Nearby Homes
- 291 Buckhorn Dr
- 1620 Bar J Rd
- 408 Reagan Dr
- 528 Clinton Dr
- 108 Villa Rosa Ridge
- 252 Spruill Bridge Rd
- 566 Clinton Dr
- 68 Villa Rosa Dr
- 159 Villa Rosa Ridge
- 396 Lakeridge Dr
- 0 Bar J Rd Unit 10578558
- 0 Bar J Rd Unit 7627694
- 196 Lakeridge Dr
- 301 Spruill Bridge Rd
- 105 Fawn Ln
- 355 Double d Rd
- 360 S Red Oak Way
- 170 Double d Rd
- 400 Bar J Rd
- 840 Windy Mill Ct
Your Personal Tour Guide
Ask me questions while you tour the home.