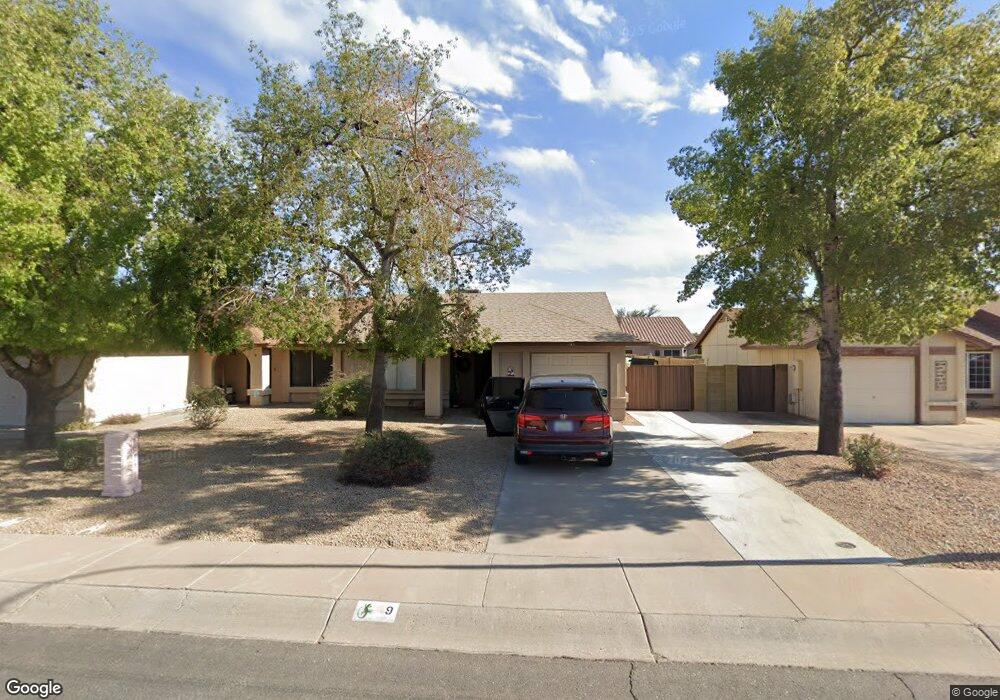
9 N Fir St Chandler, AZ 85226
West Chandler NeighborhoodEstimated Value: $294,763 - $351,000
2
Beds
2
Baths
910
Sq Ft
$355/Sq Ft
Est. Value
About This Home
This home is located at 9 N Fir St, Chandler, AZ 85226 and is currently estimated at $323,191, approximately $355 per square foot. 9 N Fir St is a home located in Maricopa County with nearby schools including Kyrene de la Paloma School, Kyrene del Pueblo Middle School, and Mountain Pointe High School.
Ownership History
Date
Name
Owned For
Owner Type
Purchase Details
Closed on
Jul 2, 2020
Sold by
Robinson Jeffory L and Robinson Carol L
Bought by
Robinson Jeffory Lamont and Robinson Carol Lynn
Current Estimated Value
Purchase Details
Closed on
Jan 21, 2016
Sold by
Eck Patricia
Bought by
Robinson Jeffory L and Robinson Carol L
Purchase Details
Closed on
Oct 16, 2001
Sold by
Eck Patricia A
Bought by
Eck Patricia
Home Financials for this Owner
Home Financials are based on the most recent Mortgage that was taken out on this home.
Original Mortgage
$80,800
Interest Rate
6.88%
Purchase Details
Closed on
Mar 18, 1994
Sold by
Mcdermott M D and Mcdermott Joanna Lowrey
Bought by
Eck Patricia A
Home Financials for this Owner
Home Financials are based on the most recent Mortgage that was taken out on this home.
Original Mortgage
$63,300
Interest Rate
7.38%
Mortgage Type
FHA
Create a Home Valuation Report for This Property
The Home Valuation Report is an in-depth analysis detailing your home's value as well as a comparison with similar homes in the area
Home Values in the Area
Average Home Value in this Area
Purchase History
| Date | Buyer | Sale Price | Title Company |
|---|---|---|---|
| Robinson Jeffory Lamont | -- | None Available | |
| Robinson Jeffory L | $160,000 | First American Title Ins Co | |
| Eck Patricia | -- | -- | |
| Eck Patricia A | $63,000 | Chicago Title Insurance Co |
Source: Public Records
Mortgage History
| Date | Status | Borrower | Loan Amount |
|---|---|---|---|
| Previous Owner | Eck Patricia | $80,800 | |
| Previous Owner | Eck Patricia A | $63,300 |
Source: Public Records
Tax History Compared to Growth
Tax History
| Year | Tax Paid | Tax Assessment Tax Assessment Total Assessment is a certain percentage of the fair market value that is determined by local assessors to be the total taxable value of land and additions on the property. | Land | Improvement |
|---|---|---|---|---|
| 2025 | $824 | $10,348 | -- | -- |
| 2024 | $788 | $9,855 | -- | -- |
| 2023 | $788 | $23,750 | $4,750 | $19,000 |
| 2022 | $750 | $18,700 | $3,740 | $14,960 |
| 2021 | $791 | $17,550 | $3,510 | $14,040 |
| 2020 | $773 | $15,230 | $3,040 | $12,190 |
| 2019 | $751 | $12,920 | $2,580 | $10,340 |
| 2018 | $726 | $11,830 | $2,360 | $9,470 |
| 2017 | $692 | $10,570 | $2,110 | $8,460 |
| 2016 | $706 | $6,810 | $1,360 | $5,450 |
| 2015 | $471 | $6,810 | $1,360 | $5,450 |
Source: Public Records
Map
Nearby Homes
- 5455 W Buffalo St
- 5151 W Glenview Place
- 5143 W Mercury Way
- 5882 W Mercury Way
- 300 N Gila Springs Blvd Unit 181
- 5137 W Jupiter Way
- 500 N Gila Springs Blvd Unit 230
- 500 N Gila Springs Blvd Unit 113
- 5665 W Galveston St Unit 76
- 255 S Kyrene Rd Unit 231
- 255 S Kyrene Rd Unit 111
- 295 N Rural Rd Unit 160
- 295 N Rural Rd Unit 128
- 295 N Rural Rd Unit 202
- 5580 W Kesler St
- 547 N Maple St
- 5751 W Del Rio St
- 5361 W Saragosa St
- 5291 W Del Rio St
- 840 S Pineview Dr
- 11 N Fir St
- 7 N Fir St
- 13 N Fir St
- 5 N Fir St
- 112 N Pineview Dr
- 102 N Pineview Dr
- 15 N Fir St
- 5512 W Commonwealth Place
- 5511 W Buffalo St
- 122 N Pineview Dr
- 92 N Pineview Dr
- 3 N Fir St
- 5516 W Commonwealth Place
- 5515 W Buffalo St
- 132 N Pineview Dr
- 82 N Pineview Dr
- 17 N Fir St Unit 1
- 1 N Fir St
- 5519 W Buffalo St
- 5520 W Commonwealth Place