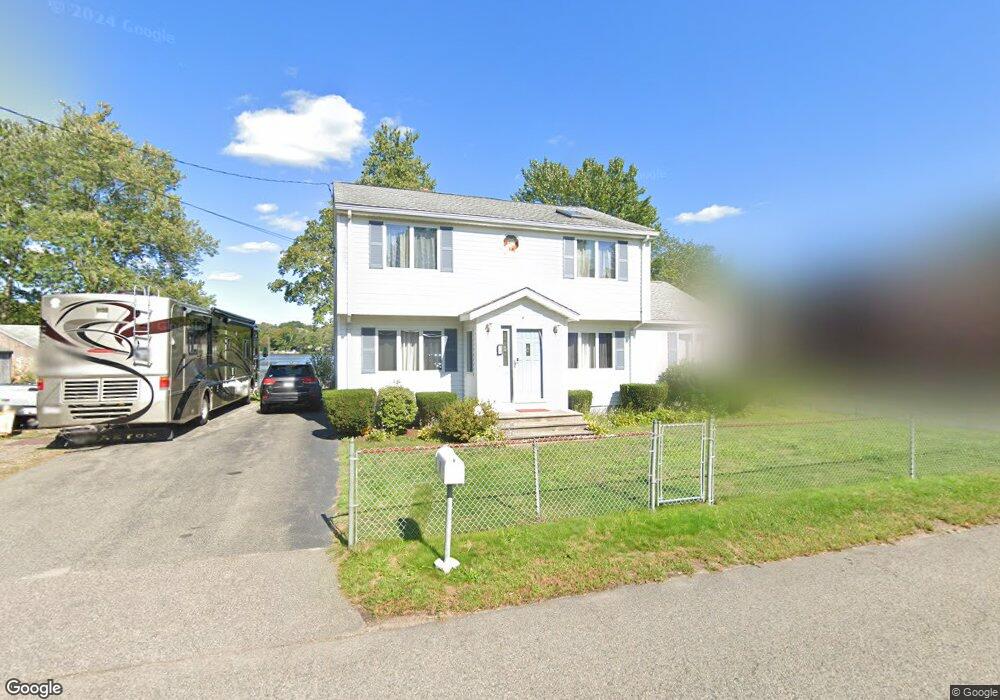
9 N Shore Rd Holbrook, MA 02343
Estimated Value: $495,910 - $595,000
4
Beds
2
Baths
1,944
Sq Ft
$287/Sq Ft
Est. Value
About This Home
This home is located at 9 N Shore Rd, Holbrook, MA 02343 and is currently estimated at $557,478, approximately $286 per square foot. 9 N Shore Rd is a home located in Norfolk County with nearby schools including John F. Kennedy Elementary School, Holbrook Middle High School, and Boston Higashi School.
Ownership History
Date
Name
Owned For
Owner Type
Purchase Details
Closed on
Feb 19, 2013
Sold by
Sarofeen Peter M and Sarofeen Dorothy A
Bought by
Lpb Rt and Sarofeen
Current Estimated Value
Purchase Details
Closed on
Aug 27, 1975
Bought by
Lpb Rt
Create a Home Valuation Report for This Property
The Home Valuation Report is an in-depth analysis detailing your home's value as well as a comparison with similar homes in the area
Home Values in the Area
Average Home Value in this Area
Purchase History
| Date | Buyer | Sale Price | Title Company |
|---|---|---|---|
| Lpb Rt | -- | -- | |
| Lpb Rt | -- | -- | |
| Lpb Rt | -- | -- | |
| Lpb Rt | $19,500 | -- |
Source: Public Records
Mortgage History
| Date | Status | Borrower | Loan Amount |
|---|---|---|---|
| Previous Owner | Lpb Rt | $40,000 | |
| Previous Owner | Lpb Rt | $40,000 |
Source: Public Records
Tax History Compared to Growth
Tax History
| Year | Tax Paid | Tax Assessment Tax Assessment Total Assessment is a certain percentage of the fair market value that is determined by local assessors to be the total taxable value of land and additions on the property. | Land | Improvement |
|---|---|---|---|---|
| 2025 | $43 | $326,400 | $113,200 | $213,200 |
| 2024 | $4,512 | $335,700 | $114,300 | $221,400 |
| 2023 | $4,566 | $296,900 | $102,400 | $194,500 |
| 2022 | $4,383 | $265,800 | $93,100 | $172,700 |
| 2021 | $4,319 | $250,800 | $84,500 | $166,300 |
| 2020 | $4,508 | $245,400 | $83,000 | $162,400 |
| 2019 | $4,630 | $237,900 | $83,000 | $154,900 |
| 2018 | $4,568 | $221,000 | $70,000 | $151,000 |
| 2017 | $4,376 | $209,400 | $63,500 | $145,900 |
| 2016 | $4,038 | $205,600 | $63,500 | $142,100 |
| 2015 | $3,757 | $196,900 | $62,500 | $134,400 |
| 2014 | $3,551 | $189,200 | $62,500 | $126,700 |
Source: Public Records
Map
Nearby Homes