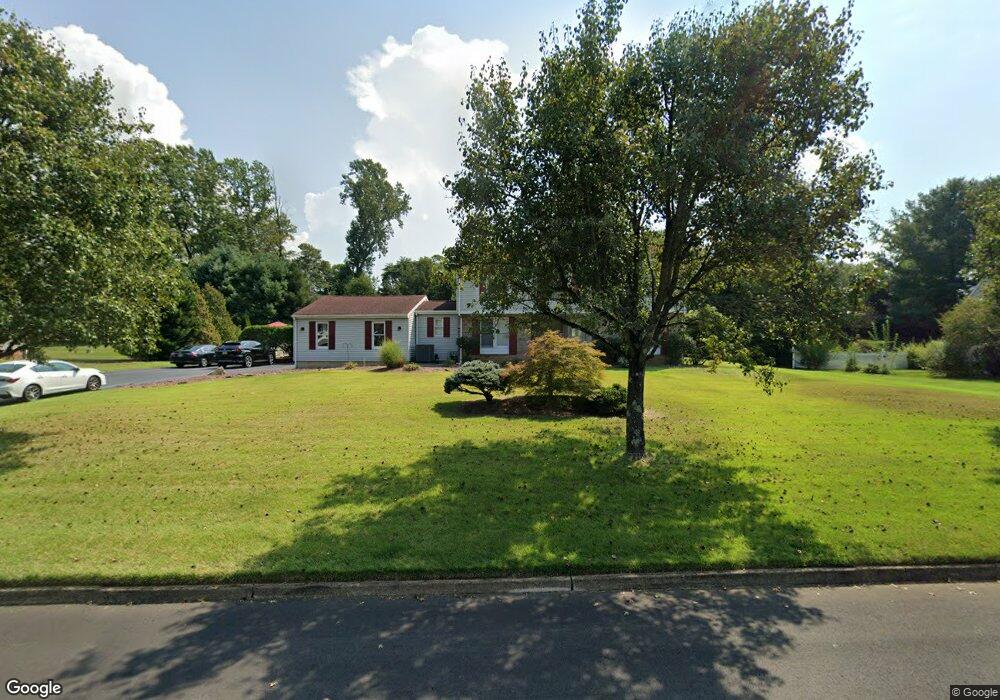
9 Nalbone Ct Trenton, NJ 08620
Estimated Value: $521,000 - $671,000
--
Bed
--
Bath
2,234
Sq Ft
$280/Sq Ft
Est. Value
About This Home
This home is located at 9 Nalbone Ct, Trenton, NJ 08620 and is currently estimated at $626,365, approximately $280 per square foot. 9 Nalbone Ct is a home located in Mercer County with nearby schools including Yardville Elementary School, Emily C. Reynolds Middle School, and Steinert - Hamilton High East.
Ownership History
Date
Name
Owned For
Owner Type
Purchase Details
Closed on
Mar 25, 2009
Sold by
Licari Joseph J and Licari Cynthia I
Bought by
Licari Joseph S and Licari Jennifer M
Current Estimated Value
Home Financials for this Owner
Home Financials are based on the most recent Mortgage that was taken out on this home.
Original Mortgage
$289,987
Outstanding Balance
$182,428
Interest Rate
4.93%
Mortgage Type
FHA
Estimated Equity
$443,937
Purchase Details
Closed on
Dec 6, 2007
Sold by
Licari Joseph J
Bought by
Licari Joseph J and Licari Cynthia
Purchase Details
Closed on
Oct 4, 2002
Sold by
Princeton Research Lands Inc
Bought by
Vogt Jeffrey and Vogt Maryelizabeth
Home Financials for this Owner
Home Financials are based on the most recent Mortgage that was taken out on this home.
Original Mortgage
$140,000
Interest Rate
6.18%
Mortgage Type
Purchase Money Mortgage
Create a Home Valuation Report for This Property
The Home Valuation Report is an in-depth analysis detailing your home's value as well as a comparison with similar homes in the area
Home Values in the Area
Average Home Value in this Area
Purchase History
| Date | Buyer | Sale Price | Title Company |
|---|---|---|---|
| Licari Joseph S | $320,000 | Commonwealth Land Title Insu | |
| Licari Joseph J | -- | -- | |
| Vogt Jeffrey | $175,000 | -- |
Source: Public Records
Mortgage History
| Date | Status | Borrower | Loan Amount |
|---|---|---|---|
| Open | Licari Joseph S | $289,987 | |
| Previous Owner | Vogt Jeffrey | $140,000 |
Source: Public Records
Tax History Compared to Growth
Tax History
| Year | Tax Paid | Tax Assessment Tax Assessment Total Assessment is a certain percentage of the fair market value that is determined by local assessors to be the total taxable value of land and additions on the property. | Land | Improvement |
|---|---|---|---|---|
| 2025 | $12,718 | $360,900 | $105,600 | $255,300 |
| 2024 | $11,921 | $360,900 | $105,600 | $255,300 |
| 2023 | $11,921 | $360,900 | $105,600 | $255,300 |
| 2022 | $11,733 | $360,900 | $105,600 | $255,300 |
| 2021 | $13,112 | $360,900 | $105,600 | $255,300 |
| 2020 | $11,812 | $360,900 | $105,600 | $255,300 |
| 2019 | $11,422 | $360,900 | $105,600 | $255,300 |
| 2018 | $11,325 | $360,900 | $105,600 | $255,300 |
| 2017 | $10,979 | $360,900 | $105,600 | $255,300 |
| 2016 | $9,759 | $360,900 | $105,600 | $255,300 |
| 2015 | $12,124 | $249,000 | $64,600 | $184,400 |
| 2014 | $11,954 | $249,000 | $64,600 | $184,400 |
Source: Public Records
Map
Nearby Homes
- 5 Meetinghouse Rd
- 3 Dartmouth Ct
- STONEHAVEN II Plan at Old York Estates
- 9 Meetinghouse Rd
- 4641 Crosswicks Hamilton Sq Rd
- 4641 Crosswicks Hamilton Square Rd
- 4503 Crosswicks Hamilton Square Rd
- 6 Meetinghouse Rd
- 8 Meetinghouse Rd
- 10 Meetinghouse Rd
- 37 Church St
- 436 Ellisdale Rd
- 21 Orourke
- 78 Kristopher Dr
- 40 Bunker Hill Dr
- 33 Bunker Hill Dr
- 14 Kristopher Dr
- 10 Powderhorn Way
- 12 Fox Ln
- 45 Bordentown Crosswicks Rd