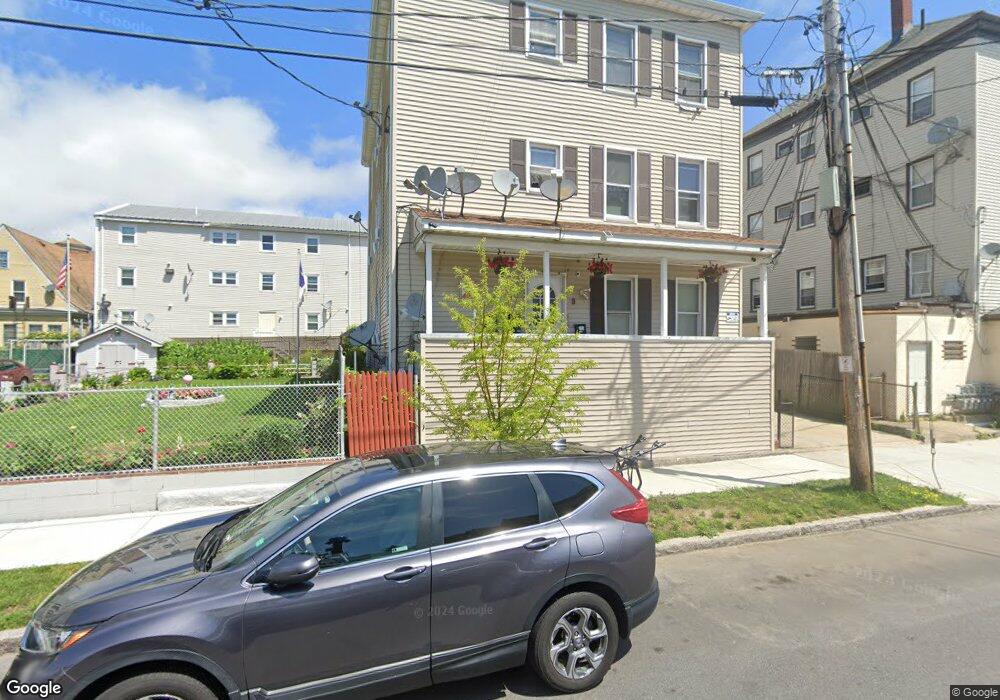
9 Nelson St New Bedford, MA 02744
The South End NeighborhoodEstimated Value: $546,275 - $629,000
9
Beds
3
Baths
3,300
Sq Ft
$181/Sq Ft
Est. Value
About This Home
This home is located at 9 Nelson St, New Bedford, MA 02744 and is currently estimated at $598,819, approximately $181 per square foot. 9 Nelson St is a home located in Bristol County with nearby schools including John B. DeValles Elementary School, Roosevelt Middle School, and New Bedford High School.
Ownership History
Date
Name
Owned For
Owner Type
Purchase Details
Closed on
May 19, 2006
Sold by
Vassal Silvina
Bought by
Martinez Maria A and Martinez Nelson D
Current Estimated Value
Home Financials for this Owner
Home Financials are based on the most recent Mortgage that was taken out on this home.
Original Mortgage
$294,577
Outstanding Balance
$170,802
Interest Rate
6.42%
Mortgage Type
Purchase Money Mortgage
Estimated Equity
$428,017
Purchase Details
Closed on
Sep 3, 2002
Sold by
Pontes Ricardo J
Bought by
Vasaal Silvina
Purchase Details
Closed on
Apr 21, 1999
Sold by
Leiriao-Desa Irene M and Leiriao James
Bought by
Pontes Ricardo J
Purchase Details
Closed on
Nov 29, 1993
Sold by
Galuska John Est
Bought by
Dasa Irene and Feiriao James M
Create a Home Valuation Report for This Property
The Home Valuation Report is an in-depth analysis detailing your home's value as well as a comparison with similar homes in the area
Home Values in the Area
Average Home Value in this Area
Purchase History
| Date | Buyer | Sale Price | Title Company |
|---|---|---|---|
| Martinez Maria A | $299,200 | -- | |
| Martinez Maria A | $299,200 | -- | |
| Vasaal Silvina | $152,500 | -- | |
| Vasaal Silvina | $152,500 | -- | |
| Pontes Ricardo J | $75,000 | -- | |
| Pontes Ricardo J | $75,000 | -- | |
| Dasa Irene | $50,000 | -- | |
| Dasa Irene | $50,000 | -- |
Source: Public Records
Mortgage History
| Date | Status | Borrower | Loan Amount |
|---|---|---|---|
| Open | Dasa Irene | $294,577 | |
| Closed | Dasa Irene | $294,577 |
Source: Public Records
Tax History Compared to Growth
Tax History
| Year | Tax Paid | Tax Assessment Tax Assessment Total Assessment is a certain percentage of the fair market value that is determined by local assessors to be the total taxable value of land and additions on the property. | Land | Improvement |
|---|---|---|---|---|
| 2025 | $5,345 | $472,600 | $77,000 | $395,600 |
| 2024 | $4,825 | $402,100 | $72,200 | $329,900 |
| 2023 | $4,327 | $302,800 | $61,600 | $241,200 |
| 2022 | $3,905 | $251,300 | $56,100 | $195,200 |
| 2021 | $3,812 | $244,500 | $56,100 | $188,400 |
| 2020 | $3,738 | $231,300 | $52,900 | $178,400 |
| 2019 | $3,205 | $194,600 | $52,900 | $141,700 |
| 2018 | $3,043 | $183,000 | $52,900 | $130,100 |
| 2017 | $2,807 | $168,200 | $52,900 | $115,300 |
| 2016 | $2,716 | $164,700 | $54,500 | $110,200 |
| 2015 | $2,556 | $162,500 | $56,100 | $106,400 |
| 2014 | $2,464 | $162,500 | $56,100 | $106,400 |
Source: Public Records
Map
Nearby Homes
- 63 County St
- 61 County St
- 61 County St Unit 4th N
- 61 County St Unit 4th S
- 14 Jouvette St Unit 15
- 14 Jouvette St
- 16 Jouvette St Unit 13
- 16 Jouvette St Unit 12
- 18 Jouvette St Unit 11
- 14 Jouvette St Unit 10
- 14 Jouvette St Unit 9
- 16 Jouvette St Unit 8
- 16 Jouvette St Unit 7
- 18 Jouvette St Unit 6
- 14 Jouvette St Unit 5
- 14 Jouvette St Unit 4
- 16 Jouvette St Unit 3
- 16 Jouvette St Unit 2
- 18 Jouvette St Unit 1
- 18 Jouvette St Unit E2