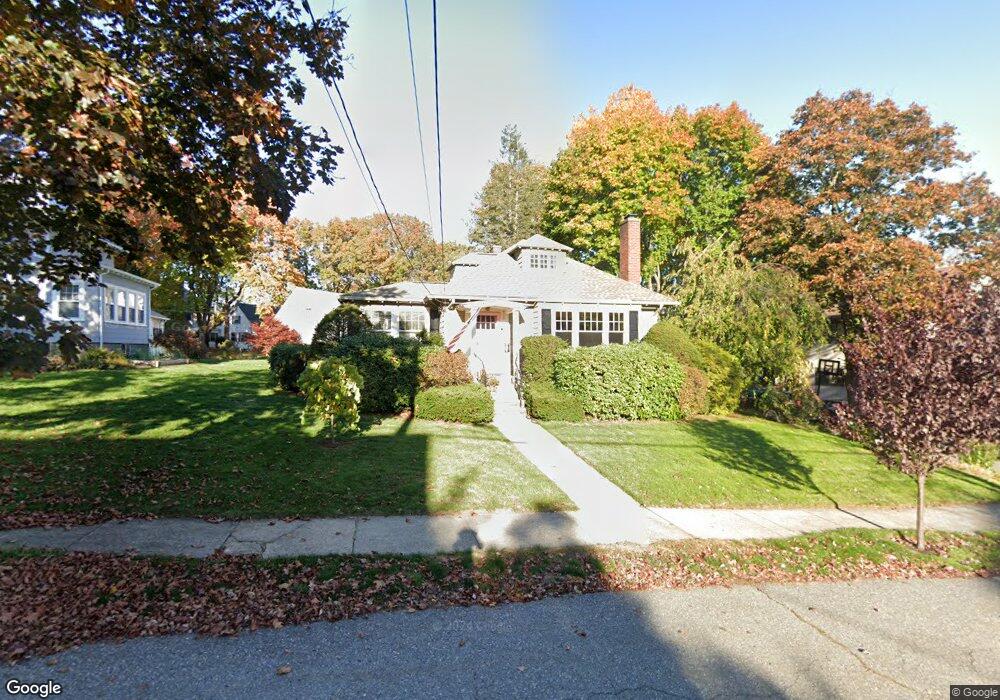
9 Newell Rd Wakefield, MA 01880
West Side NeighborhoodEstimated Value: $774,000 - $949,000
2
Beds
3
Baths
1,729
Sq Ft
$490/Sq Ft
Est. Value
About This Home
This home is located at 9 Newell Rd, Wakefield, MA 01880 and is currently estimated at $846,751, approximately $489 per square foot. 9 Newell Rd is a home located in Middlesex County with nearby schools including Wakefield Memorial High School, St Joseph School, and St. Patrick Elementary School.
Ownership History
Date
Name
Owned For
Owner Type
Purchase Details
Closed on
Sep 18, 1992
Sold by
Whiting Warren L and Whiting Marion H
Bought by
Reilly Nancy L
Current Estimated Value
Home Financials for this Owner
Home Financials are based on the most recent Mortgage that was taken out on this home.
Original Mortgage
$70,000
Interest Rate
8.04%
Mortgage Type
Purchase Money Mortgage
Create a Home Valuation Report for This Property
The Home Valuation Report is an in-depth analysis detailing your home's value as well as a comparison with similar homes in the area
Home Values in the Area
Average Home Value in this Area
Purchase History
| Date | Buyer | Sale Price | Title Company |
|---|---|---|---|
| Reilly Nancy L | $180,000 | -- |
Source: Public Records
Mortgage History
| Date | Status | Borrower | Loan Amount |
|---|---|---|---|
| Closed | Reilly Nancy L | $70,000 |
Source: Public Records
Tax History Compared to Growth
Tax History
| Year | Tax Paid | Tax Assessment Tax Assessment Total Assessment is a certain percentage of the fair market value that is determined by local assessors to be the total taxable value of land and additions on the property. | Land | Improvement |
|---|---|---|---|---|
| 2025 | $7,976 | $702,700 | $365,100 | $337,600 |
| 2024 | $7,676 | $682,300 | $354,400 | $327,900 |
| 2023 | $7,415 | $632,100 | $328,100 | $304,000 |
| 2022 | $7,086 | $575,200 | $298,300 | $276,900 |
| 2021 | $6,547 | $514,300 | $277,200 | $237,100 |
| 2020 | $6,297 | $493,100 | $265,700 | $227,400 |
| 2019 | $6,090 | $474,700 | $256,600 | $218,100 |
| 2018 | $5,764 | $445,100 | $240,500 | $204,600 |
| 2017 | $5,525 | $424,000 | $229,100 | $194,900 |
| 2016 | $5,476 | $405,900 | $211,700 | $194,200 |
| 2015 | $5,120 | $379,800 | $197,900 | $181,900 |
| 2014 | $4,706 | $368,200 | $191,800 | $176,400 |
Source: Public Records
Map
Nearby Homes
- 5 Byron St
- 10 Converse St
- 4 Vernon Ave
- 97 Macarthur Rd
- 4 Adams St
- 62 High St Unit 4
- 62 High St Unit 3
- 62 High St Unit Lot 12
- 62 High St Unit Lot 2
- 62 High St Unit Lot 7
- 62 High St Unit Lot 9
- 32 Garden Rd
- 34 Duncklee Ave
- 106 Elm St
- 59 Norval Ave
- 25 Penny Ln
- 69 Foundry St Unit 416
- 69 Foundry St Unit 310
- 90 Prospect St
- 62 Foundry St Unit 310