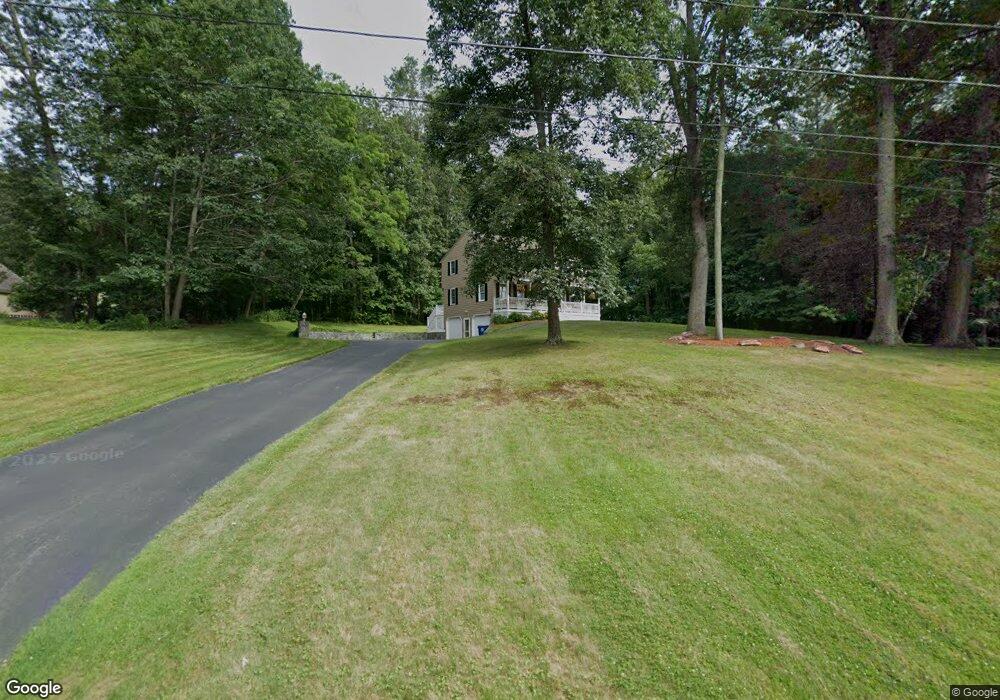
9 Nottingham Rd Tyngsboro, MA 01879
Estimated Value: $653,028 - $709,000
4
Beds
2
Baths
1,800
Sq Ft
$377/Sq Ft
Est. Value
About This Home
This home is located at 9 Nottingham Rd, Tyngsboro, MA 01879 and is currently estimated at $678,507, approximately $376 per square foot. 9 Nottingham Rd is a home located in Middlesex County with nearby schools including Tyngsborough Elementary School, Tyngsborough Middle School, and Tyngsborough High School.
Ownership History
Date
Name
Owned For
Owner Type
Purchase Details
Closed on
Jun 13, 2016
Sold by
Kearney Christopher T and Kearney Jessica L
Bought by
9 Nottingham Road Rt
Current Estimated Value
Purchase Details
Closed on
Aug 30, 1985
Bought by
Kearney Joseph P and Kearney Gail M
Create a Home Valuation Report for This Property
The Home Valuation Report is an in-depth analysis detailing your home's value as well as a comparison with similar homes in the area
Home Values in the Area
Average Home Value in this Area
Purchase History
| Date | Buyer | Sale Price | Title Company |
|---|---|---|---|
| 9 Nottingham Road Rt | -- | -- | |
| Kearney Christopher T | -- | -- | |
| Kearney Joseph P | $129,700 | -- |
Source: Public Records
Mortgage History
| Date | Status | Borrower | Loan Amount |
|---|---|---|---|
| Previous Owner | Kearney Joseph P | $100,000 | |
| Previous Owner | Kearney Joseph P | $90,000 | |
| Previous Owner | Kearney Joseph P | $50,000 | |
| Previous Owner | Kearney Joseph P | $60,000 |
Source: Public Records
Tax History Compared to Growth
Tax History
| Year | Tax Paid | Tax Assessment Tax Assessment Total Assessment is a certain percentage of the fair market value that is determined by local assessors to be the total taxable value of land and additions on the property. | Land | Improvement |
|---|---|---|---|---|
| 2025 | $72 | $582,000 | $265,700 | $316,300 |
| 2024 | $7,217 | $567,400 | $259,200 | $308,200 |
| 2023 | $6,818 | $482,200 | $215,600 | $266,600 |
| 2022 | $6,511 | $435,800 | $187,300 | $248,500 |
| 2021 | $6,375 | $396,700 | $169,900 | $226,800 |
| 2020 | $6,240 | $384,000 | $161,200 | $222,800 |
| 2019 | $6,020 | $355,600 | $152,500 | $203,100 |
| 2018 | $5,958 | $348,200 | $152,500 | $195,700 |
| 2017 | $5,786 | $337,200 | $152,500 | $184,700 |
| 2016 | $5,696 | $324,400 | $152,500 | $171,900 |
| 2015 | $5,427 | $320,000 | $148,100 | $171,900 |
Source: Public Records
Map
Nearby Homes
- 109 Sherburne Ave
- 111 Sherburne Ave
- 123 Sherburne Ave
- 17 Juniper Ln Unit 17
- 20 Juniper Ln Unit 67
- 22 Juniper Ln Unit 66
- 28 Juniper Ln Unit 65
- 11 Juniper Ln Unit 14
- 32 Juniper Ln Unit 61
- 43 Juniper Ln Unit 30
- 26 Juniper Ln Unit 64
- 30 Tamarack Way Unit 30
- 24 Old Tyng Rd
- 5 Bridgeview Cir Unit 22
- 1 Patricia Dr
- 46 Pawtucket Blvd Unit 37
- 54 Mascuppic Trail
- 44 Shakespeare St
- 10 Dickens Ln
- 75 Frost Rd
- 11 Nottingham Rd
- 7 Nottingham Rd
- 8 Nottingham Rd
- 6 Nottingham Rd
- 5 Nottingham Rd
- 12 Robinhood Rd
- 13 Nottingham Rd
- 6 Corcoran Dr
- 4 Nottingham Rd
- 11 Robinhood Rd
- 4 Corcoran Dr
- 4 Cocoran Dr
- 12 Nottingham Rd
- 15 Nottingham Rd
- 9 Robinhood Rd
- 3 Nottingham Rd
- 10 Robinhood Rd
- 2 Nottingham Rd
- 9 Corcoran Dr
- 8 Robinhood Rd