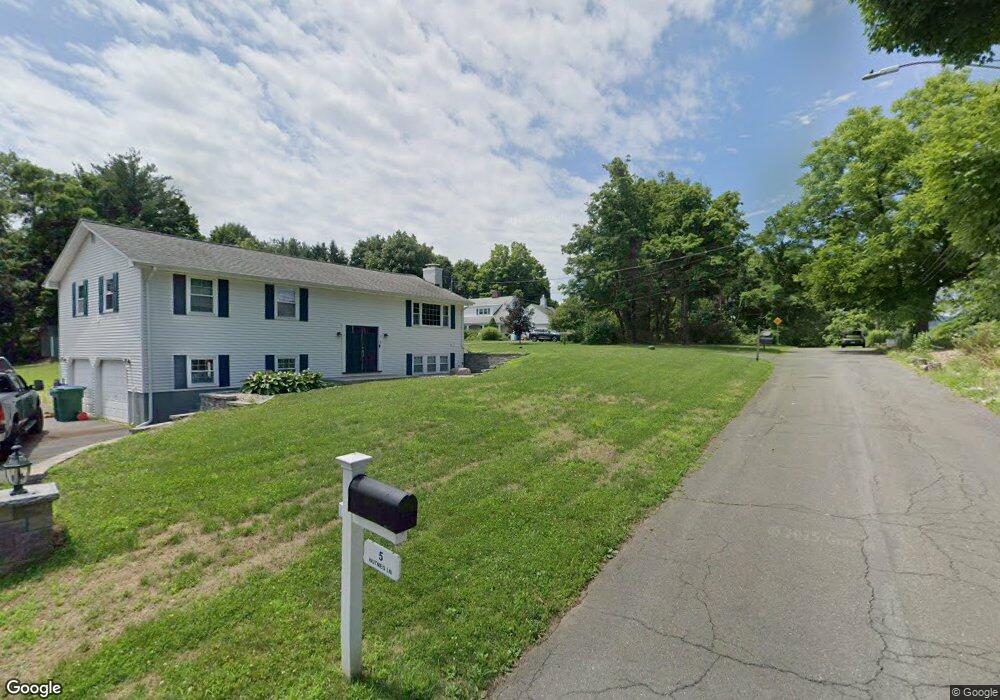
9 Nutmeg Ln Bloomfield, CT 06002
Estimated Value: $413,650 - $434,000
4
Beds
6
Baths
1,828
Sq Ft
$230/Sq Ft
Est. Value
About This Home
This home is located at 9 Nutmeg Ln, Bloomfield, CT 06002 and is currently estimated at $419,913, approximately $229 per square foot. 9 Nutmeg Ln is a home located in Hartford County with nearby schools including Laurel School, Carmen Arace Intermediate School, and Metacomet School.
Ownership History
Date
Name
Owned For
Owner Type
Purchase Details
Closed on
Dec 17, 2010
Sold by
Snow Patrick
Bought by
Charette-Harris Mary
Current Estimated Value
Home Financials for this Owner
Home Financials are based on the most recent Mortgage that was taken out on this home.
Original Mortgage
$198,400
Interest Rate
4.23%
Mortgage Type
Purchase Money Mortgage
Purchase Details
Closed on
May 22, 2008
Sold by
Fine Arthur Est and Blume
Bought by
Snow Patrick
Purchase Details
Closed on
Aug 20, 1996
Sold by
Alan Temkin Assoc
Bought by
Butler Paulette and Butler Onika
Create a Home Valuation Report for This Property
The Home Valuation Report is an in-depth analysis detailing your home's value as well as a comparison with similar homes in the area
Home Values in the Area
Average Home Value in this Area
Purchase History
| Date | Buyer | Sale Price | Title Company |
|---|---|---|---|
| Charette-Harris Mary | $248,000 | -- | |
| Charette-Harris Mary | $248,000 | -- | |
| Snow Patrick | $280,000 | -- | |
| Snow Patrick | $280,000 | -- | |
| Butler Paulette | $155,395 | -- | |
| Butler Paulette | $155,395 | -- |
Source: Public Records
Mortgage History
| Date | Status | Borrower | Loan Amount |
|---|---|---|---|
| Open | Butler Paulette | $246,000 | |
| Closed | Butler Paulette | $198,400 |
Source: Public Records
Tax History
| Year | Tax Paid | Tax Assessment Tax Assessment Total Assessment is a certain percentage of the fair market value that is determined by local assessors to be the total taxable value of land and additions on the property. | Land | Improvement |
|---|---|---|---|---|
| 2025 | $9,075 | $241,990 | $63,210 | $178,780 |
| 2024 | $6,535 | $166,530 | $54,880 | $111,650 |
| 2023 | $6,416 | $166,530 | $54,880 | $111,650 |
| 2022 | $6,000 | $166,530 | $54,880 | $111,650 |
| 2021 | $6,133 | $166,530 | $54,880 | $111,650 |
| 2020 | $6,038 | $166,530 | $54,880 | $111,650 |
| 2019 | $6,438 | $166,530 | $54,880 | $111,650 |
| 2018 | $6,053 | $156,730 | $58,100 | $98,630 |
| 2017 | $6,044 | $156,730 | $58,100 | $98,630 |
| 2016 | $5,901 | $156,730 | $58,100 | $98,630 |
| 2015 | $5,791 | $156,730 | $58,100 | $98,630 |
| 2014 | $6,275 | $175,560 | $61,250 | $114,310 |
Source: Public Records
Map
Nearby Homes
- 234 Woodland Ave
- 406 Tunxis Ave
- 322 Tunxis Ave
- 162 Thistle Pond Dr
- 81 Silo Way Unit 81
- 63 Duncaster Rd
- 12 Filley St
- 99 Oliver Way Unit 99
- 26 Burnwood Dr
- 50 Habitat Ln
- 79 Prospect St
- 6 Spy Glass Cir
- 545 Simsbury Rd
- 1211R Blue Hills Ave
- 1220 Blue Hills Ave
- 2 Camelot Dr Unit 4
- 24 Hunting Ridge Dr
- 49 Tyler St
- 159 School St
- 256 Park Ave
Your Personal Tour Guide
Ask me questions while you tour the home.