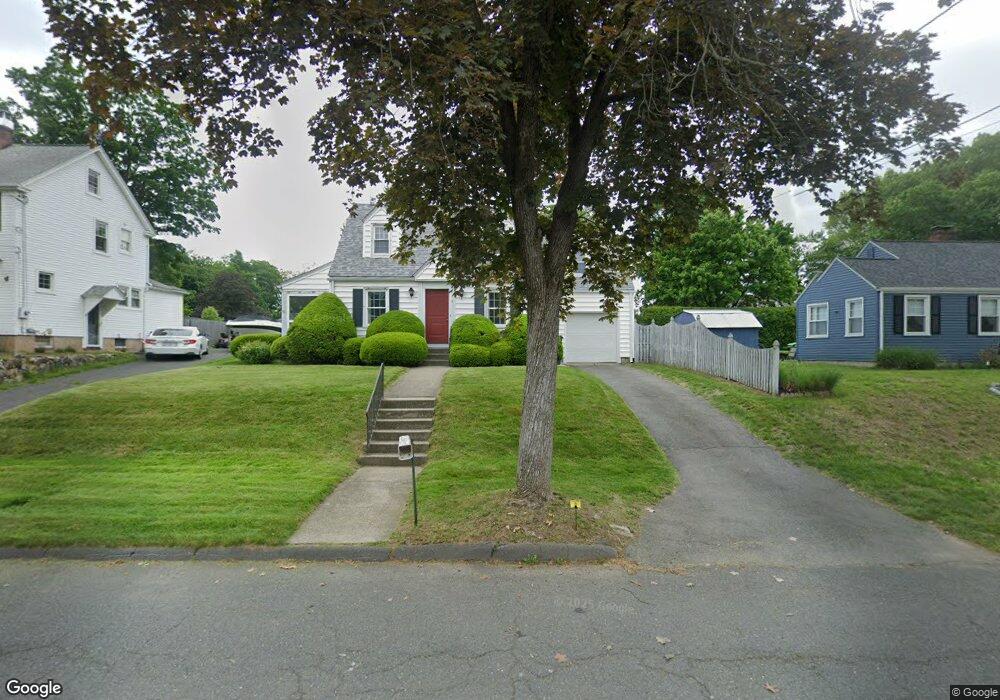
9 Oak St Westfield, MA 01085
Estimated Value: $308,913 - $317,000
3
Beds
1
Bath
1,068
Sq Ft
$294/Sq Ft
Est. Value
About This Home
This home is located at 9 Oak St, Westfield, MA 01085 and is currently estimated at $313,478, approximately $293 per square foot. 9 Oak St is a home located in Hampden County with nearby schools including Westfield High School and Saint Mary High School.
Ownership History
Date
Name
Owned For
Owner Type
Purchase Details
Closed on
Sep 17, 1999
Sold by
Daigle Leroy
Bought by
Lafond Patrick N and Culver Kathleen M
Current Estimated Value
Home Financials for this Owner
Home Financials are based on the most recent Mortgage that was taken out on this home.
Original Mortgage
$170,000
Outstanding Balance
$50,438
Interest Rate
7.83%
Mortgage Type
Purchase Money Mortgage
Estimated Equity
$263,040
Create a Home Valuation Report for This Property
The Home Valuation Report is an in-depth analysis detailing your home's value as well as a comparison with similar homes in the area
Home Values in the Area
Average Home Value in this Area
Purchase History
| Date | Buyer | Sale Price | Title Company |
|---|---|---|---|
| Lafond Patrick N | $190,000 | -- |
Source: Public Records
Mortgage History
| Date | Status | Borrower | Loan Amount |
|---|---|---|---|
| Open | Lafond Patrick N | $170,000 | |
| Previous Owner | Lafond Patrick N | $64,000 | |
| Previous Owner | Lafond Patrick N | $70,000 | |
| Previous Owner | Lafond Patrick N | $75,000 |
Source: Public Records
Tax History Compared to Growth
Tax History
| Year | Tax Paid | Tax Assessment Tax Assessment Total Assessment is a certain percentage of the fair market value that is determined by local assessors to be the total taxable value of land and additions on the property. | Land | Improvement |
|---|---|---|---|---|
| 2025 | $4,045 | $266,500 | $111,800 | $154,700 |
| 2024 | $4,026 | $252,100 | $101,700 | $150,400 |
| 2023 | $3,903 | $228,600 | $96,800 | $131,800 |
| 2022 | $3,744 | $202,500 | $86,500 | $116,000 |
| 2021 | $3,623 | $191,900 | $81,600 | $110,300 |
| 2020 | $3,529 | $183,300 | $81,600 | $101,700 |
| 2019 | $3,442 | $175,000 | $77,600 | $97,400 |
| 2018 | $3,388 | $175,000 | $77,600 | $97,400 |
| 2017 | $3,338 | $171,900 | $78,800 | $93,100 |
| 2016 | $3,342 | $171,900 | $78,800 | $93,100 |
| 2015 | $3,187 | $171,900 | $78,800 | $93,100 |
| 2014 | $2,381 | $171,900 | $78,800 | $93,100 |
Source: Public Records
Map
Nearby Homes
- 70 S Maple St
- 82 S Maple St Unit 43
- 82 S Maple St Unit 11
- 74 S Maple St
- 70-74 S Maple St
- 128 Crane Ave
- 172 Valley View Dr
- 78 Granville Rd Unit 11
- 15 Bates St
- 13 King Place
- 16 Yale St
- 11 Highland Cir
- 69 Beveridge Blvd
- 51 Washington St
- 113 Franklin St
- 8 Ellis St
- 205 Russell Rd
- 77 Orange St
- 33 George St
- 324 Russell Rd Unit 204