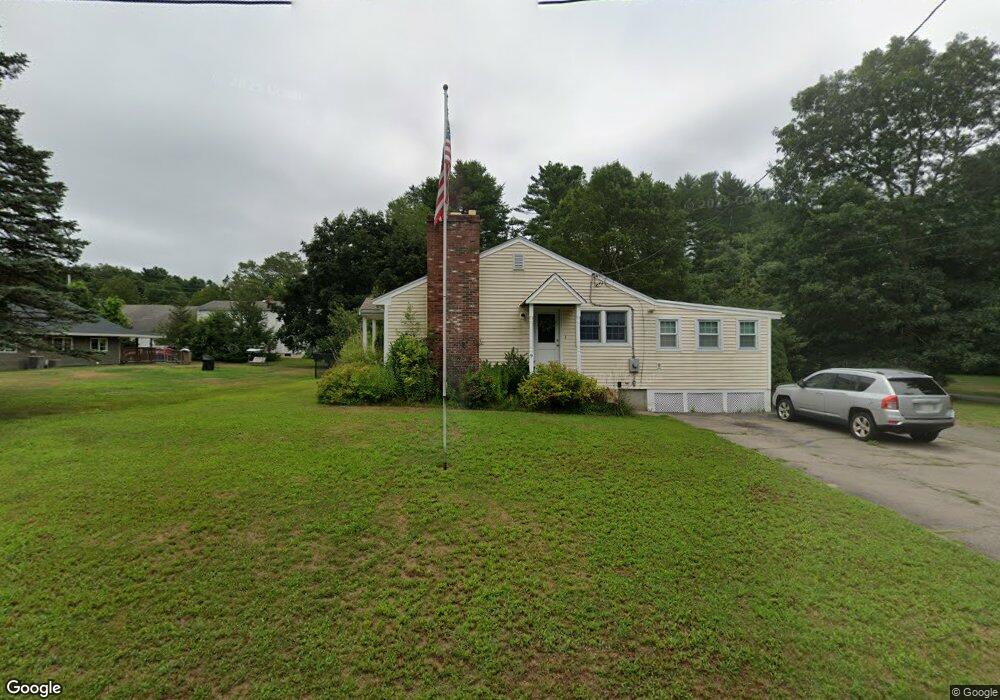
9 Old Colony Rd Foxboro, MA 02035
Estimated Value: $602,563 - $651,000
3
Beds
1
Bath
1,552
Sq Ft
$405/Sq Ft
Est. Value
About This Home
This home is located at 9 Old Colony Rd, Foxboro, MA 02035 and is currently estimated at $628,641, approximately $405 per square foot. 9 Old Colony Rd is a home located in Norfolk County with nearby schools including Foxborough High School, Foxborough Regional Charter School, and The Sage School.
Ownership History
Date
Name
Owned For
Owner Type
Purchase Details
Closed on
Jan 12, 2022
Sold by
Obrien Mathew W
Bought by
Tsebetzis Jessica
Current Estimated Value
Home Financials for this Owner
Home Financials are based on the most recent Mortgage that was taken out on this home.
Original Mortgage
$350,000
Outstanding Balance
$320,981
Interest Rate
3.05%
Mortgage Type
Purchase Money Mortgage
Estimated Equity
$307,660
Purchase Details
Closed on
Nov 16, 2007
Sold by
Jondro Alan D
Bought by
Obrien Mathew W
Home Financials for this Owner
Home Financials are based on the most recent Mortgage that was taken out on this home.
Original Mortgage
$170,000
Interest Rate
6.41%
Mortgage Type
Purchase Money Mortgage
Create a Home Valuation Report for This Property
The Home Valuation Report is an in-depth analysis detailing your home's value as well as a comparison with similar homes in the area
Home Values in the Area
Average Home Value in this Area
Purchase History
| Date | Buyer | Sale Price | Title Company |
|---|---|---|---|
| Tsebetzis Jessica | $500,000 | None Available | |
| Obrien Mathew W | $340,000 | -- | |
| Obrien Mathew W | $340,000 | -- |
Source: Public Records
Mortgage History
| Date | Status | Borrower | Loan Amount |
|---|---|---|---|
| Open | Tsebetzis Jessica | $350,000 | |
| Previous Owner | Obrien Mathew W | $170,000 | |
| Previous Owner | Obrien Mathew W | $71,000 | |
| Previous Owner | Obrien Mathew W | $10,000 |
Source: Public Records
Tax History Compared to Growth
Tax History
| Year | Tax Paid | Tax Assessment Tax Assessment Total Assessment is a certain percentage of the fair market value that is determined by local assessors to be the total taxable value of land and additions on the property. | Land | Improvement |
|---|---|---|---|---|
| 2025 | $6,086 | $460,400 | $196,200 | $264,200 |
| 2024 | $6,075 | $449,700 | $211,500 | $238,200 |
| 2023 | $5,563 | $391,500 | $201,400 | $190,100 |
| 2022 | $5,486 | $377,800 | $180,500 | $197,300 |
| 2021 | $5,358 | $363,500 | $171,500 | $192,000 |
| 2020 | $5,063 | $347,500 | $171,500 | $176,000 |
| 2019 | $5,016 | $341,200 | $171,900 | $169,300 |
| 2018 | $4,748 | $325,900 | $163,300 | $162,600 |
| 2017 | $4,662 | $310,000 | $160,700 | $149,300 |
| 2016 | $4,570 | $308,400 | $154,600 | $153,800 |
| 2015 | $4,138 | $272,400 | $115,200 | $157,200 |
| 2014 | $4,134 | $275,800 | $115,200 | $160,600 |
Source: Public Records
Map
Nearby Homes
- 11 Goodwin Dr
- 131 Washington St Unit 42
- 25 Foxboro Rd
- 11 Orchard Place Unit 11
- 7 Hill St Unit 10
- 14 Baker St
- 65 Pond St
- 14 Foxhill Rd
- 24 Mechanic St
- 35 Shoreline Dr
- 73 Ridge Rd
- 1 Eisenhauer Ln
- 71 Pond St
- 483 Thurston St
- 16R Eldor Dr
- 2 Thompson Rd
- 80 Mill St
- 362 East St
- 84 Cocasset St Unit A6
- 375 Winter St