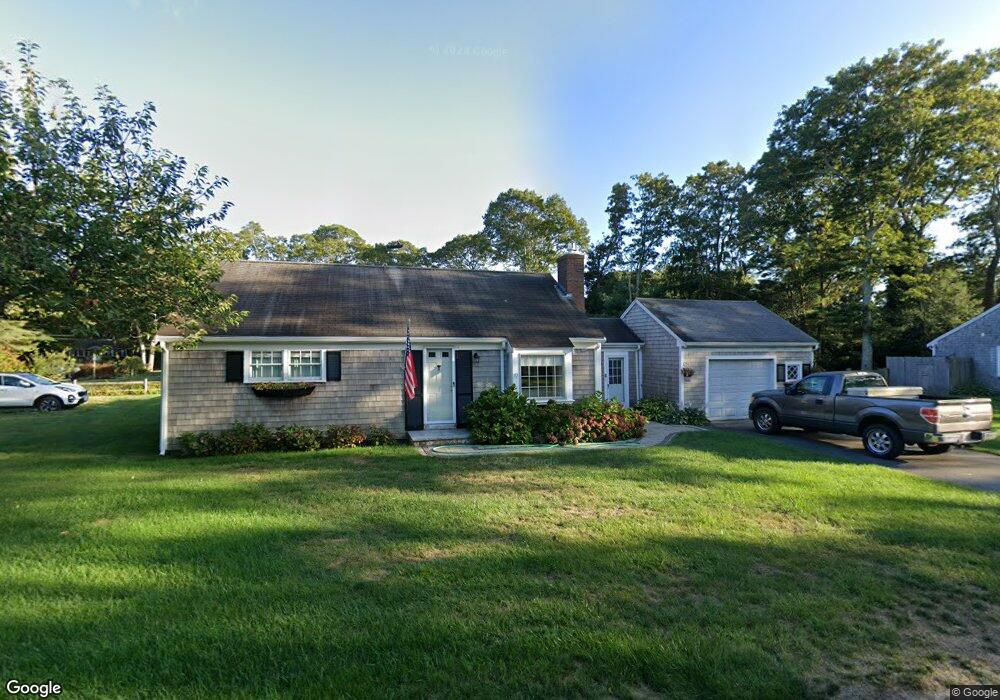
9 Olde Dennis Approach South Dennis, MA 02660
South Dennis NeighborhoodEstimated Value: $514,000 - $560,000
2
Beds
1
Bath
936
Sq Ft
$571/Sq Ft
Est. Value
About This Home
This home is located at 9 Olde Dennis Approach, South Dennis, MA 02660 and is currently estimated at $534,004, approximately $570 per square foot. 9 Olde Dennis Approach is a home located in Barnstable County with nearby schools including Dennis-Yarmouth Regional High School and St. Pius X. School.
Ownership History
Date
Name
Owned For
Owner Type
Purchase Details
Closed on
Apr 18, 2008
Sold by
Gilligan-Suydam Maryann
Bought by
Bushey Steven
Current Estimated Value
Home Financials for this Owner
Home Financials are based on the most recent Mortgage that was taken out on this home.
Original Mortgage
$201,600
Outstanding Balance
$128,569
Interest Rate
6.1%
Mortgage Type
Purchase Money Mortgage
Estimated Equity
$405,435
Create a Home Valuation Report for This Property
The Home Valuation Report is an in-depth analysis detailing your home's value as well as a comparison with similar homes in the area
Home Values in the Area
Average Home Value in this Area
Purchase History
| Date | Buyer | Sale Price | Title Company |
|---|---|---|---|
| Bushey Steven | $252,000 | -- |
Source: Public Records
Mortgage History
| Date | Status | Borrower | Loan Amount |
|---|---|---|---|
| Open | Bushey Steven | $201,600 |
Source: Public Records
Tax History Compared to Growth
Tax History
| Year | Tax Paid | Tax Assessment Tax Assessment Total Assessment is a certain percentage of the fair market value that is determined by local assessors to be the total taxable value of land and additions on the property. | Land | Improvement |
|---|---|---|---|---|
| 2025 | $2,046 | $472,600 | $97,100 | $375,500 |
| 2024 | $1,899 | $432,600 | $93,400 | $339,200 |
| 2023 | $1,837 | $393,400 | $84,900 | $308,500 |
| 2022 | $1,773 | $316,600 | $89,200 | $227,400 |
| 2021 | $3,388 | $293,200 | $106,200 | $187,000 |
| 2020 | $1,607 | $263,500 | $93,700 | $169,800 |
| 2019 | $1,612 | $261,300 | $110,200 | $151,100 |
| 2018 | $3,087 | $240,600 | $104,900 | $135,700 |
| 2017 | $2,727 | $236,300 | $104,900 | $131,400 |
| 2016 | $1,469 | $225,000 | $116,600 | $108,400 |
| 2015 | $1,357 | $212,000 | $116,600 | $95,400 |
| 2014 | $1,346 | $212,000 | $116,600 | $95,400 |
Source: Public Records
Map
Nearby Homes
- 6 Hawthorn St
- 62 Old Fish House Rd
- 40 Viking Dr
- 2 Hemlock Ln
- 1 Norseman Dr
- 7 Vinland Dr
- 25 Skerry Rd
- 241 Old Bass River Rd
- 10 Joanne Dr
- 20 Sycamore Ln
- 401 Main St Unit 201
- 401 Main St Unit 101
- 3 Jennifer Ln
- 17 Fairmount Rd
- 17 Fairmount Rd
- 31 Duck Pond Rd
- 85 Keel Cape Dr
- 29 Highland St
- 0 Ash Ct
- 37 Cyprus Rd
- 7 Westover
- 1 Olde Approach
- 8 Olde Dennis Approach
- 46 Old Bass River Rd
- 1 Olde Dennis Approach
- 19 Olde Dennis Approach
- 14 Olde Dennis Approach
- 2 Olde Dennis Approach
- 20 Olde Dennis Approach
- 14 Westover
- 40 Old Bass River Rd
- 14 Westover
- 13 Westover
- 11 Westover
- 20 Westover
- 15 Westover
- 36 Old Bass River Rd
- 7 Riverdale S
- 25 Olde Dennis Approach
- 2 Riverdale N