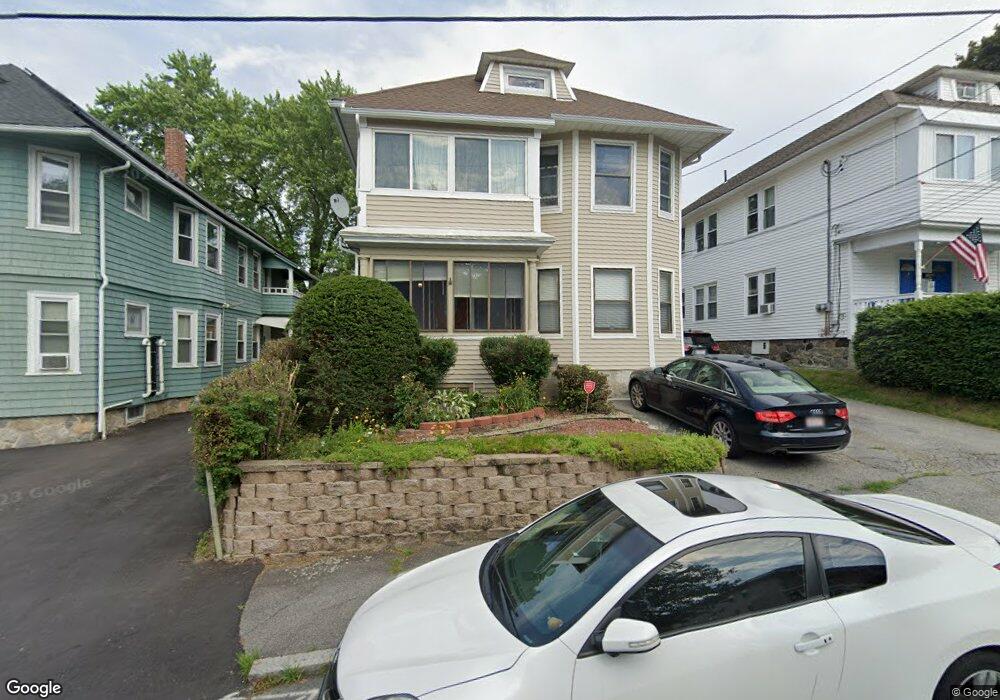
9 Olive St Unit 11 Methuen, MA 01844
The East End NeighborhoodEstimated Value: $728,280 - $778,000
6
Beds
3
Baths
2,816
Sq Ft
$266/Sq Ft
Est. Value
About This Home
This home is located at 9 Olive St Unit 11, Methuen, MA 01844 and is currently estimated at $749,570, approximately $266 per square foot. 9 Olive St Unit 11 is a home located in Essex County with nearby schools including Timony Grammar School, South Point Elementary School, and Methuen High School.
Ownership History
Date
Name
Owned For
Owner Type
Purchase Details
Closed on
May 17, 2016
Sold by
Cepeda Sandra and Romulus Ramilla S
Bought by
Cepeda Sandra and Cepeda-Romulus Leocelin
Current Estimated Value
Purchase Details
Closed on
Apr 28, 2006
Sold by
Lamirande Sarah M and Lamirande Steven
Bought by
Cepeda-Romulus Leocelin and Romulus Ramilla S
Home Financials for this Owner
Home Financials are based on the most recent Mortgage that was taken out on this home.
Original Mortgage
$305,600
Interest Rate
6.4%
Mortgage Type
Purchase Money Mortgage
Purchase Details
Closed on
Jan 9, 2001
Sold by
Zakarian Henry
Bought by
Lamirande Steven and Lamirande Sarah M
Home Financials for this Owner
Home Financials are based on the most recent Mortgage that was taken out on this home.
Original Mortgage
$158,850
Interest Rate
7.69%
Mortgage Type
Purchase Money Mortgage
Create a Home Valuation Report for This Property
The Home Valuation Report is an in-depth analysis detailing your home's value as well as a comparison with similar homes in the area
Home Values in the Area
Average Home Value in this Area
Purchase History
| Date | Buyer | Sale Price | Title Company |
|---|---|---|---|
| Cepeda Sandra | -- | -- | |
| Cepeda-Romulus Leocelin | $382,000 | -- | |
| Lamirande Steven | $188,000 | -- |
Source: Public Records
Mortgage History
| Date | Status | Borrower | Loan Amount |
|---|---|---|---|
| Previous Owner | Cepeda-Romulus Leocelin | $305,600 | |
| Previous Owner | Lamirande Steven | $158,850 |
Source: Public Records
Tax History Compared to Growth
Tax History
| Year | Tax Paid | Tax Assessment Tax Assessment Total Assessment is a certain percentage of the fair market value that is determined by local assessors to be the total taxable value of land and additions on the property. | Land | Improvement |
|---|---|---|---|---|
| 2025 | $7,513 | $710,100 | $190,600 | $519,500 |
| 2024 | $6,843 | $630,100 | $173,900 | $456,200 |
| 2023 | $6,704 | $573,000 | $154,600 | $418,400 |
| 2022 | $5,993 | $459,200 | $122,400 | $336,800 |
| 2021 | $5,731 | $434,500 | $115,900 | $318,600 |
| 2020 | $5,474 | $407,300 | $115,900 | $291,400 |
| 2019 | $5,029 | $354,400 | $109,500 | $244,900 |
| 2018 | $4,653 | $326,100 | $103,000 | $223,100 |
| 2017 | $4,565 | $311,600 | $103,000 | $208,600 |
| 2016 | $4,076 | $275,200 | $90,200 | $185,000 |
| 2015 | $3,885 | $266,100 | $90,200 | $175,900 |
Source: Public Records
Map
Nearby Homes
- 24 Boylston St
- 24 Court St
- 15 Swan Ave
- 9 Boylston St
- 35 Swan Ave
- 20 Knox St Unit 43
- 20 Knox St Unit 23
- 35 Kendall St
- 167 Ferry 53 Mann St Unit 2,5,6
- 63 Lippold St
- 6 Longwood Dr
- 68 Wesley St
- 4 Alderbrook Ln
- 100-102 E Haverhill St
- 5 Harmony Ln
- 29 Meadowbrook Rd
- 106 Leroy Ave
- 7 Magnolia Rd
- 169 Berkeley St
- 183 Berkeley St
- 9-11 Olive St
- 5 - 7 Olive St
- 5 Olive St
- 13 Olive St Unit 15
- 13-15 Olive St
- 17 Olive St Unit 19
- 17-19 Olive St
- 17-19 Olive St Unit 2
- 19 Olive St Unit 2
- 30 Vermont St Unit 32
- 24-28 Vermont St
- 85 Boston St Unit 87
- 89 Boston St Unit 91
- 24 Vermont St Unit 28
- 34-36 Vermont St
- 34 Vermont St Unit 36
- 21 Olive St Unit 23
- 21-23 Olive St
- 81 Boston St Unit 83
- 8 Olive St Unit 10