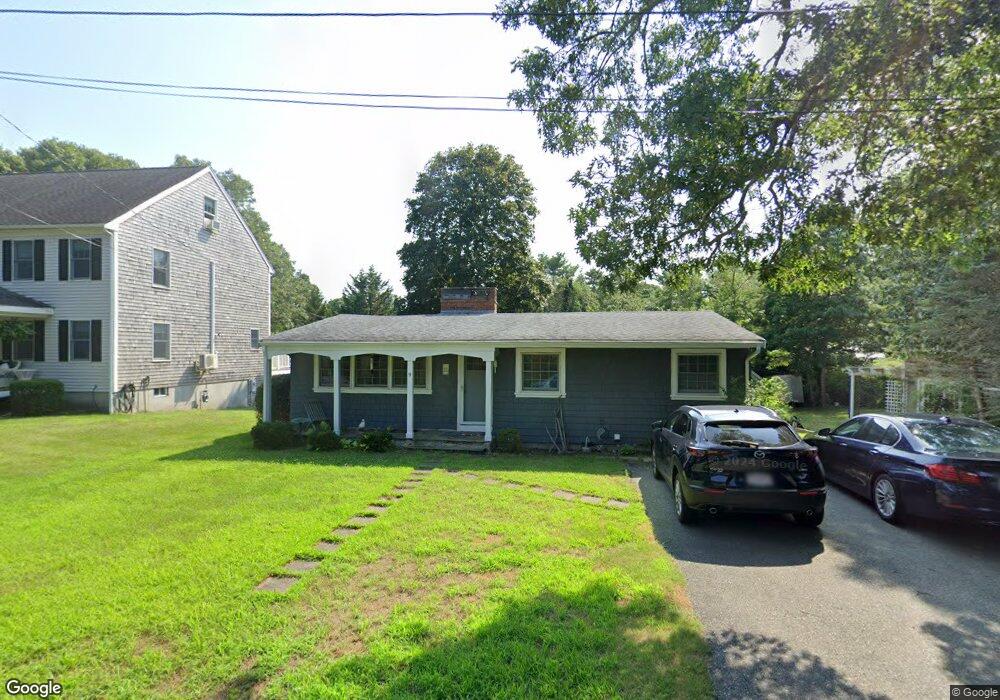
9 Olney Rd Bourne, MA 2532
Bourne AreaEstimated Value: $474,000 - $684,000
About This Home
This home is located at 9 Olney Rd, Bourne, MA 2532 and is currently estimated at $568,164, approximately $553 per square foot. 9 Olney Rd is a home located in Barnstable County with nearby schools including Bourne High School, St Margaret Regional School, and Cadence Academy Preschool - Bourne.
Ownership History
We collect this data history from publicly available records. To have your information removed, we recommend requesting removal directly through your county’s website.
Purchase Details
Purchase Details
Purchase Details
Purchase History
We collect this data history from publicly available records. To have your information removed, we recommend requesting removal directly through your county’s website.
| Date | Buyer | Sale Price | Title Company |
|---|---|---|---|
| $285,000 | None Available | ||
| $129,000 | -- | ||
| $76,000 | -- |
Mortgage History
We collect this data history from publicly available records. To have your information removed, we recommend requesting removal directly through your county’s website.
| Date | Status | Borrower | Loan Amount |
|---|---|---|---|
| Closed | $70,000 | ||
| Previous Owner | $135,000 | ||
| Closed | $96,000 |
Tax History
We collect this data history from publicly available records. To have your information removed, we recommend requesting removal directly through your county’s website.
| Year | Tax Paid | Tax Assessment Tax Assessment Total Assessment is a certain percentage of the fair market value that is determined by local assessors to be the total taxable value of land and additions on the property. | Land | Improvement |
|---|---|---|---|---|
| 2025 | $3,444 | $441,000 | $233,800 | $207,200 |
| 2024 | $3,368 | $420,000 | $222,700 | $197,300 |
| 2023 | $3,275 | $371,700 | $197,100 | $174,600 |
| 2022 | $3,158 | $313,000 | $174,400 | $138,600 |
| 2021 | $3,068 | $284,900 | $158,700 | $126,200 |
| 2020 | $2,978 | $277,300 | $157,200 | $120,100 |
| 2019 | $3,027 | $288,000 | $174,700 | $113,300 |
| 2018 | $2,834 | $268,900 | $166,400 | $102,500 |
| 2017 | $2,743 | $266,300 | $164,800 | $101,500 |
| 2016 | $2,386 | $234,800 | $148,300 | $86,500 |
| 2015 | $2,143 | $212,800 | $126,300 | $86,500 |
Map
- 22 Presidents Rd
- 30 Seabreeze Dr
- 2 Jefferson Rd
- 4 Cross Rd
- 5 Bell Rd
- 43 Seabreeze Dr
- 57 Academy Dr
- 35 Benedict Rd
- 151 - 153 Main St
- 00 Summer St Unit B
- 29 Lafayette Ave
- 46 Holt Rd Unit A
- 46 Holt Rd Unit A
- 34 Washington Ave
- 13 Harrison Ave
- 10 Harrison Ave Unit 2
- 10 Harrison Ave Unit 3
- 10 Harrison Ave Unit 4
- 10 Harrison Ave Unit 1
- 2 Kendall Rae Place Unit 1320
Ask me questions while you tour the home.