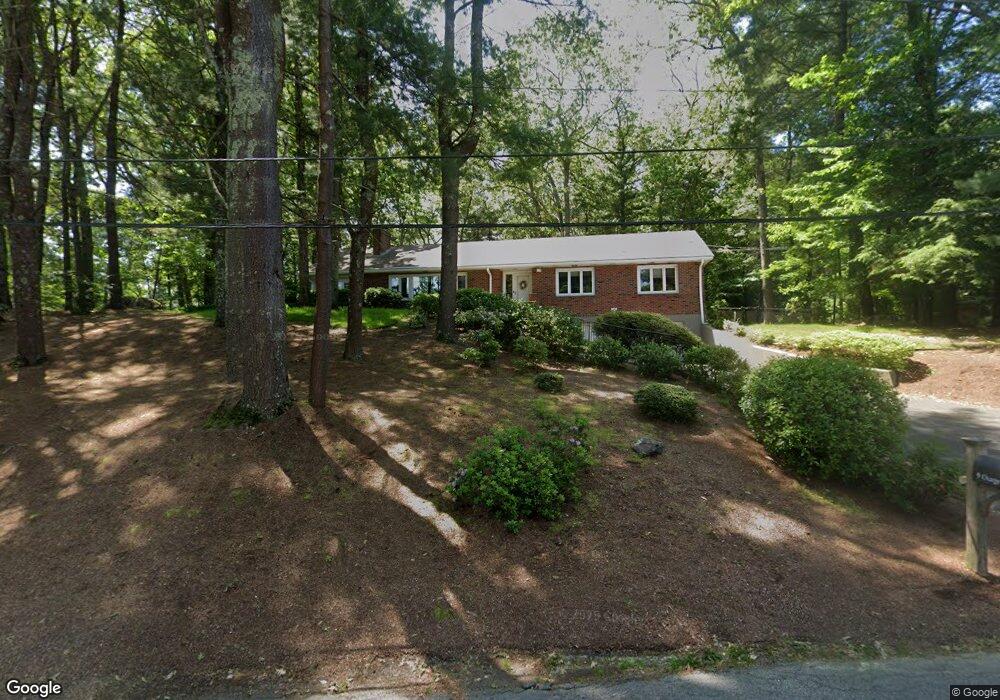
9 Osage Rd Canton, MA 02021
Estimated Value: $883,697 - $1,259,000
3
Beds
4
Baths
2,160
Sq Ft
$502/Sq Ft
Est. Value
About This Home
This home is located at 9 Osage Rd, Canton, MA 02021 and is currently estimated at $1,084,674, approximately $502 per square foot. 9 Osage Rd is a home located in Norfolk County with nearby schools including Canton High School and St. John the Evangelist School.
Ownership History
Date
Name
Owned For
Owner Type
Purchase Details
Closed on
Dec 30, 2014
Sold by
Orkin Jonathan P and Orkin Ellen J
Bought by
Ellen J Orkin T
Current Estimated Value
Purchase Details
Closed on
May 27, 2005
Sold by
Mccarthy Brendan B and Mccarthy Nicole C
Bought by
Orkin Ellen J and Orkin Jonathan P
Home Financials for this Owner
Home Financials are based on the most recent Mortgage that was taken out on this home.
Original Mortgage
$544,000
Interest Rate
5.94%
Mortgage Type
Purchase Money Mortgage
Purchase Details
Closed on
Jul 27, 2001
Sold by
Whitman Lewis L and Whitman Sylvia L
Bought by
Mccarthy Brendan B and Mccarthy Nicole C
Home Financials for this Owner
Home Financials are based on the most recent Mortgage that was taken out on this home.
Original Mortgage
$367,200
Interest Rate
7.18%
Mortgage Type
Purchase Money Mortgage
Create a Home Valuation Report for This Property
The Home Valuation Report is an in-depth analysis detailing your home's value as well as a comparison with similar homes in the area
Home Values in the Area
Average Home Value in this Area
Purchase History
| Date | Buyer | Sale Price | Title Company |
|---|---|---|---|
| Ellen J Orkin T | -- | -- | |
| Orkin Ellen J | $680,000 | -- | |
| Mccarthy Brendan B | $459,000 | -- |
Source: Public Records
Mortgage History
| Date | Status | Borrower | Loan Amount |
|---|---|---|---|
| Previous Owner | Mccarthy Brendan B | $292,000 | |
| Previous Owner | Orkin Ellen J | $544,000 | |
| Previous Owner | Mccarthy Brendan B | $367,200 | |
| Previous Owner | Mccarthy Brendan B | $58,000 |
Source: Public Records
Tax History Compared to Growth
Tax History
| Year | Tax Paid | Tax Assessment Tax Assessment Total Assessment is a certain percentage of the fair market value that is determined by local assessors to be the total taxable value of land and additions on the property. | Land | Improvement |
|---|---|---|---|---|
| 2025 | $8,093 | $818,300 | $370,000 | $448,300 |
| 2024 | $7,571 | $759,400 | $355,800 | $403,600 |
| 2023 | $7,511 | $710,600 | $355,800 | $354,800 |
| 2022 | $7,128 | $628,000 | $338,800 | $289,200 |
| 2021 | $7,053 | $578,100 | $308,000 | $270,100 |
| 2020 | $6,736 | $550,800 | $293,300 | $257,500 |
| 2019 | $6,690 | $539,500 | $266,600 | $272,900 |
| 2018 | $6,578 | $529,600 | $267,000 | $262,600 |
| 2017 | $6,752 | $527,900 | $261,800 | $266,100 |
| 2016 | $6,982 | $545,900 | $286,100 | $259,800 |
| 2015 | $6,818 | $531,800 | $277,800 | $254,000 |
Source: Public Records
Map
Nearby Homes
- 7 Surrey Ln
- 1904 Washington St
- 35 Turnpike St
- 130 University Ave Unit 1405
- 120 University Ave Unit 2308
- 59 Turnpike St
- 1649 Washington St
- 2204 Davenport Ave Unit 2204
- 48 Oakdale Rd
- 360 Blue Hill Dr
- 84 Juniper Ridge Rd
- 350 Blue Hill Dr
- 243 Weatherbee Dr
- 215 Blue Hill Dr
- 264 Pleasant St
- 355 Canton St
- 19 Cushing Rd
- 15 Kensington Dr
- 187 Vincent Rd
- 69 Hastings Rd