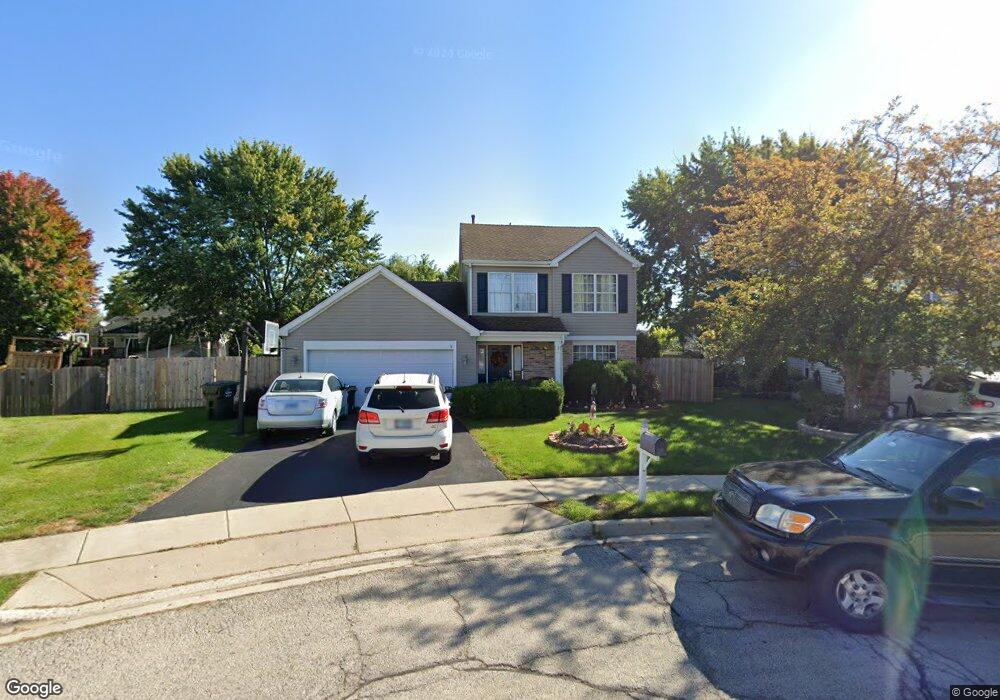
9 Oxford Ct South Elgin, IL 60177
Estimated Value: $340,000 - $424,000
3
Beds
2
Baths
1,678
Sq Ft
$225/Sq Ft
Est. Value
About This Home
This home is located at 9 Oxford Ct, South Elgin, IL 60177 and is currently estimated at $378,256, approximately $225 per square foot. 9 Oxford Ct is a home located in Kane County with nearby schools including Clinton Elementary School, Kenyon Woods Middle School, and South Elgin High School.
Ownership History
Date
Name
Owned For
Owner Type
Purchase Details
Closed on
Jun 15, 2004
Sold by
Turner Thomas D and Turner Caroline A
Bought by
Mcmanus Joseph A
Current Estimated Value
Home Financials for this Owner
Home Financials are based on the most recent Mortgage that was taken out on this home.
Original Mortgage
$222,409
Interest Rate
6.37%
Mortgage Type
FHA
Purchase Details
Closed on
Nov 13, 2000
Sold by
Mcnichols Daniel J and Mcnichols Donna Jeanne
Bought by
Turner Thomas D and Turner Caroline A
Home Financials for this Owner
Home Financials are based on the most recent Mortgage that was taken out on this home.
Original Mortgage
$150,000
Interest Rate
7.77%
Purchase Details
Closed on
Sep 13, 1994
Sold by
First Colonial Trust Company
Bought by
Mcnichols Daniel J and Mcnichols Donna Jeanne
Home Financials for this Owner
Home Financials are based on the most recent Mortgage that was taken out on this home.
Original Mortgage
$106,000
Interest Rate
7.87%
Create a Home Valuation Report for This Property
The Home Valuation Report is an in-depth analysis detailing your home's value as well as a comparison with similar homes in the area
Home Values in the Area
Average Home Value in this Area
Purchase History
| Date | Buyer | Sale Price | Title Company |
|---|---|---|---|
| Mcmanus Joseph A | $226,000 | -- | |
| Turner Thomas D | $170,500 | Chicago Title Insurance Co | |
| Mcnichols Daniel J | $133,000 | First American Title Insuran |
Source: Public Records
Mortgage History
| Date | Status | Borrower | Loan Amount |
|---|---|---|---|
| Open | Mcmanus Joseph A | $230,972 | |
| Closed | Mcmanus Joseph A | $252,858 | |
| Closed | Mcmanus Joseph A | $241,062 | |
| Closed | Mcmanus Joseph A | $201,600 | |
| Closed | Mcmanus Joseph A | $25,200 | |
| Closed | Mcmanus Joseph A | $222,409 | |
| Previous Owner | Turner Thomas D | $152,000 | |
| Previous Owner | Turner Thomas D | $150,000 | |
| Previous Owner | Turner Thomas D | $15,000 | |
| Previous Owner | Turner Thomas D | $150,000 | |
| Previous Owner | Ncnichols Daniel J | $104,000 | |
| Previous Owner | Mcnichols Daniel J | $106,000 |
Source: Public Records
Tax History Compared to Growth
Tax History
| Year | Tax Paid | Tax Assessment Tax Assessment Total Assessment is a certain percentage of the fair market value that is determined by local assessors to be the total taxable value of land and additions on the property. | Land | Improvement |
|---|---|---|---|---|
| 2024 | $7,612 | $104,457 | $28,317 | $76,140 |
| 2023 | $7,246 | $94,369 | $25,582 | $68,787 |
| 2022 | $6,889 | $86,048 | $23,326 | $62,722 |
| 2021 | $6,484 | $80,449 | $21,808 | $58,641 |
| 2020 | $6,286 | $76,801 | $20,819 | $55,982 |
| 2019 | $6,052 | $73,157 | $19,831 | $53,326 |
| 2018 | $5,930 | $68,918 | $18,682 | $50,236 |
| 2017 | $5,632 | $65,152 | $17,661 | $47,491 |
| 2016 | $5,359 | $60,444 | $16,385 | $44,059 |
| 2015 | -- | $55,402 | $15,018 | $40,384 |
| 2014 | -- | $49,293 | $14,833 | $34,460 |
| 2013 | -- | $50,593 | $15,224 | $35,369 |
Source: Public Records
Map
Nearby Homes
- 291 Kingsport Dr
- 8N594 S Mclean Blvd
- 289 Kingsport Dr
- 311 Kingsport Dr
- 287 Kingsport Dr
- 309 Kingsport Dr
- 285 Kingsport Dr
- 307 Kingsport Dr
- 283 Kingsport Dr
- 305 Kingsport Dr
- 281 Kingsport Dr
- 303 Kingsport Dr
- 301 Kingsport Dr
- 400 Comstock Rd
- Harrison Plan at Becketts Landing - The Townes at Becketts
- Talman Plan at Becketts Landing - The Townes at Becketts
- Stewart Plan at Becketts Landing - The Townes at Becketts
- Meade Plan at Becketts Landing - The Townes at Becketts
- 126 Kingsport Dr
- 300 Kingsport Dr
- 11 Oxford Ct
- 7 Oxford Ct
- 224 Mayfair Ln
- 228 Mayfair Ln
- 220 Mayfair Ln
- 15 Oxford Ct
- 232 Mayfair Ln
- 1172 Oxford Ln
- 5 Oxford Ct
- 1125 N Harvard Cir
- 1139 N Harvard Cir
- 238 Mayfair Ln
- 1160 Oxford Ln
- 3 Oxford Ct
- 1105 N Harvard Cir
- 1 Oxford Ct
- 1151 N Harvard Cir Unit 1
- 221 Mayfair Ln
- 242 Mayfair Ln
- 229 Mayfair Ln