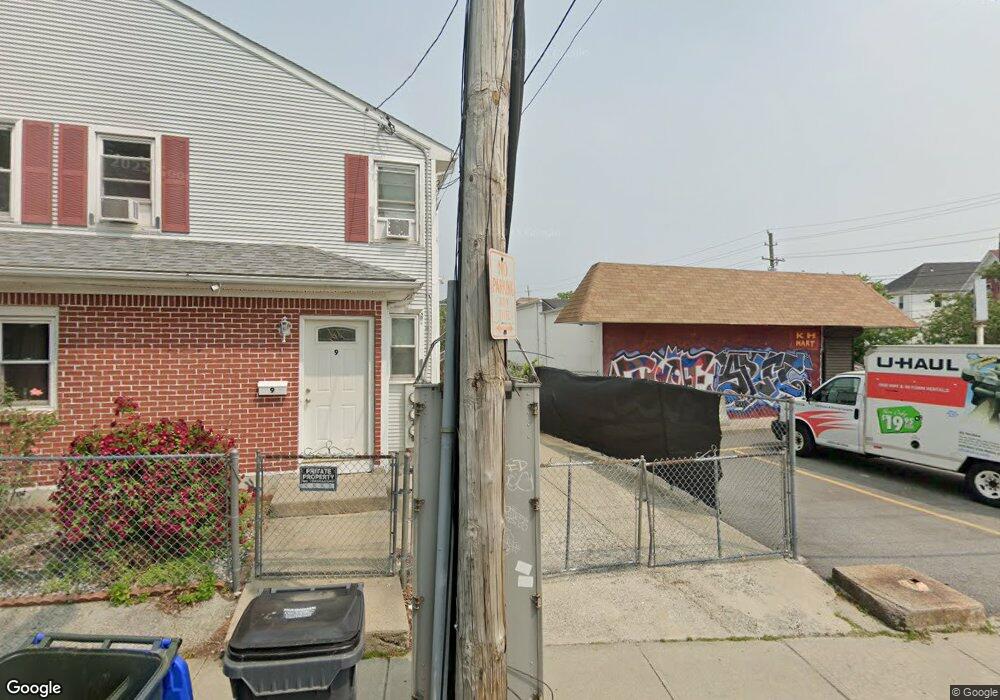
9 Parnell St Unit 13 Providence, RI 02909
Manton NeighborhoodEstimated Value: $538,239 - $667,000
2
Beds
2
Baths
1,336
Sq Ft
$473/Sq Ft
Est. Value
About This Home
This home is located at 9 Parnell St Unit 13, Providence, RI 02909 and is currently estimated at $631,310, approximately $472 per square foot. 9 Parnell St Unit 13 is a home located in Providence County with nearby schools including Charles N. Fortes Elementary School, Asa Messer Elementary School, and Laurel Hill Annex School.
Ownership History
Date
Name
Owned For
Owner Type
Purchase Details
Closed on
Apr 22, 2021
Sold by
Murillo Dhamarys N
Bought by
Hernandez Luisa A
Current Estimated Value
Home Financials for this Owner
Home Financials are based on the most recent Mortgage that was taken out on this home.
Original Mortgage
$281,250
Outstanding Balance
$254,138
Interest Rate
3.05%
Mortgage Type
Purchase Money Mortgage
Estimated Equity
$377,172
Purchase Details
Closed on
May 26, 2017
Sold by
Murillo Dhamarys N and Hernandez Petronila A
Bought by
Murillo Dhamarys N
Home Financials for this Owner
Home Financials are based on the most recent Mortgage that was taken out on this home.
Original Mortgage
$137,800
Interest Rate
4.08%
Mortgage Type
New Conventional
Purchase Details
Closed on
Aug 18, 2016
Sold by
Reyes Brian R and Hernandez Petronila A
Bought by
Hernandez Petronila A and Murllo Dhamarys N
Purchase Details
Closed on
Dec 20, 2013
Sold by
Reyes Brian R
Bought by
Reyes Brian R and Hernandez Petronila A
Purchase Details
Closed on
Apr 9, 2012
Sold by
Murillo Dhamarys
Bought by
Reyes Brian R
Purchase Details
Closed on
Mar 12, 2012
Sold by
Hernandez Petronila A
Bought by
Murillo Dhamarys
Purchase Details
Closed on
Oct 24, 2002
Sold by
Crudale Adolfo and Crudale Marilin
Bought by
Hernandez Petronila A
Home Financials for this Owner
Home Financials are based on the most recent Mortgage that was taken out on this home.
Original Mortgage
$129,450
Interest Rate
6.2%
Mortgage Type
Purchase Money Mortgage
Purchase Details
Closed on
Aug 17, 2000
Sold by
Resident Area Inv
Bought by
Crudale Adolfo
Purchase Details
Closed on
May 19, 1999
Sold by
Dailey Brian A
Bought by
Resident Area Inv Llc
Purchase Details
Closed on
Mar 26, 1997
Sold by
Second Stage Dev Llc
Bought by
Dailey Brian A
Purchase Details
Closed on
Jan 19, 1995
Sold by
Fleet Nb
Bought by
Amado Jean P
Create a Home Valuation Report for This Property
The Home Valuation Report is an in-depth analysis detailing your home's value as well as a comparison with similar homes in the area
Home Values in the Area
Average Home Value in this Area
Purchase History
| Date | Buyer | Sale Price | Title Company |
|---|---|---|---|
| Hernandez Luisa A | $375,000 | None Available | |
| Murillo Dhamarys N | -- | -- | |
| Hernandez Petronila A | -- | -- | |
| Reyes Brian R | -- | -- | |
| Reyes Brian R | -- | -- | |
| Murillo Dhamarys | -- | -- | |
| Hernandez Petronila A | $136,500 | -- | |
| Crudale Adolfo | $115,000 | -- | |
| Resident Area Inv Llc | $75,000 | -- | |
| Dailey Brian A | $120,000 | -- | |
| Second Stage Dev Llc | $71,000 | -- | |
| Amado Jean P | $68,000 | -- |
Source: Public Records
Mortgage History
| Date | Status | Borrower | Loan Amount |
|---|---|---|---|
| Open | Hernandez Luisa A | $281,250 | |
| Previous Owner | Murillo Dhamarys N | $137,800 | |
| Previous Owner | Amado Jean P | $55,000 | |
| Previous Owner | Amado Jean P | $129,450 | |
| Previous Owner | Amado Jean P | $3,792 |
Source: Public Records
Tax History Compared to Growth
Tax History
| Year | Tax Paid | Tax Assessment Tax Assessment Total Assessment is a certain percentage of the fair market value that is determined by local assessors to be the total taxable value of land and additions on the property. | Land | Improvement |
|---|---|---|---|---|
| 2025 | $7,374 | $526,700 | $130,900 | $395,800 |
| 2024 | $6,562 | $357,600 | $75,700 | $281,900 |
| 2023 | $6,562 | $357,600 | $75,700 | $281,900 |
| 2022 | $6,365 | $357,600 | $75,700 | $281,900 |
| 2021 | $6,111 | $248,800 | $55,900 | $192,900 |
| 2020 | $6,111 | $248,800 | $55,900 | $192,900 |
| 2019 | $6,238 | $254,000 | $55,900 | $198,100 |
| 2018 | $4,845 | $151,600 | $35,900 | $115,700 |
| 2017 | $4,845 | $151,600 | $35,900 | $115,700 |
| 2016 | $4,845 | $151,600 | $35,900 | $115,700 |
| 2015 | $3,992 | $120,600 | $32,900 | $87,700 |
| 2014 | $4,070 | $120,600 | $32,900 | $87,700 |
| 2013 | $4,070 | $120,600 | $32,900 | $87,700 |
Source: Public Records
Map
Nearby Homes