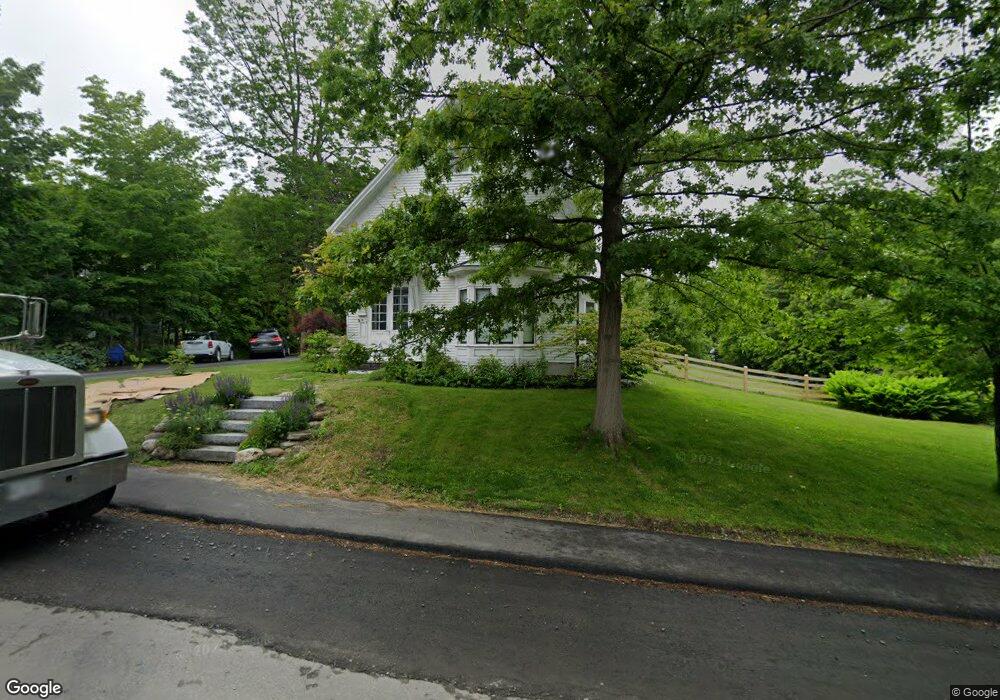
9 Pearl St Camden, ME 04843
Estimated Value: $751,000 - $950,000
3
Beds
3
Baths
2,326
Sq Ft
$359/Sq Ft
Est. Value
About This Home
This home is located at 9 Pearl St, Camden, ME 04843 and is currently estimated at $834,367, approximately $358 per square foot. 9 Pearl St is a home located in Knox County with nearby schools including Camden-Rockport Elementary School, Camden-Rockport Middle School, and Camden Hills Regional High School.
Ownership History
Date
Name
Owned For
Owner Type
Purchase Details
Closed on
Nov 5, 2013
Sold by
Canter Stephen E and Canter Carol M
Bought by
Walker Whitney R and Walker Marcellina
Current Estimated Value
Home Financials for this Owner
Home Financials are based on the most recent Mortgage that was taken out on this home.
Original Mortgage
$417,000
Outstanding Balance
$307,476
Interest Rate
4.52%
Mortgage Type
Purchase Money Mortgage
Estimated Equity
$526,891
Create a Home Valuation Report for This Property
The Home Valuation Report is an in-depth analysis detailing your home's value as well as a comparison with similar homes in the area
Home Values in the Area
Average Home Value in this Area
Purchase History
| Date | Buyer | Sale Price | Title Company |
|---|---|---|---|
| Walker Whitney R | -- | -- |
Source: Public Records
Mortgage History
| Date | Status | Borrower | Loan Amount |
|---|---|---|---|
| Open | Walker Whitney R | $417,000 |
Source: Public Records
Tax History Compared to Growth
Tax History
| Year | Tax Paid | Tax Assessment Tax Assessment Total Assessment is a certain percentage of the fair market value that is determined by local assessors to be the total taxable value of land and additions on the property. | Land | Improvement |
|---|---|---|---|---|
| 2024 | $7,993 | $761,200 | $280,300 | $480,900 |
| 2023 | $8,134 | $589,400 | $153,800 | $435,600 |
| 2022 | $7,780 | $589,400 | $153,800 | $435,600 |
| 2021 | $7,296 | $475,300 | $119,000 | $356,300 |
| 2020 | $6,770 | $450,400 | $119,000 | $331,400 |
| 2019 | $6,715 | $450,400 | $119,000 | $331,400 |
| 2018 | $6,102 | $410,100 | $135,200 | $274,900 |
| 2017 | $5,897 | $410,100 | $135,200 | $274,900 |
| 2016 | $5,587 | $358,400 | $84,300 | $274,100 |
| 2015 | $5,398 | $356,800 | $84,300 | $272,500 |
| 2014 | $5,149 | $356,800 | $84,300 | $272,500 |
| 2013 | $5,009 | $356,800 | $84,300 | $272,500 |
Source: Public Records
Map
Nearby Homes