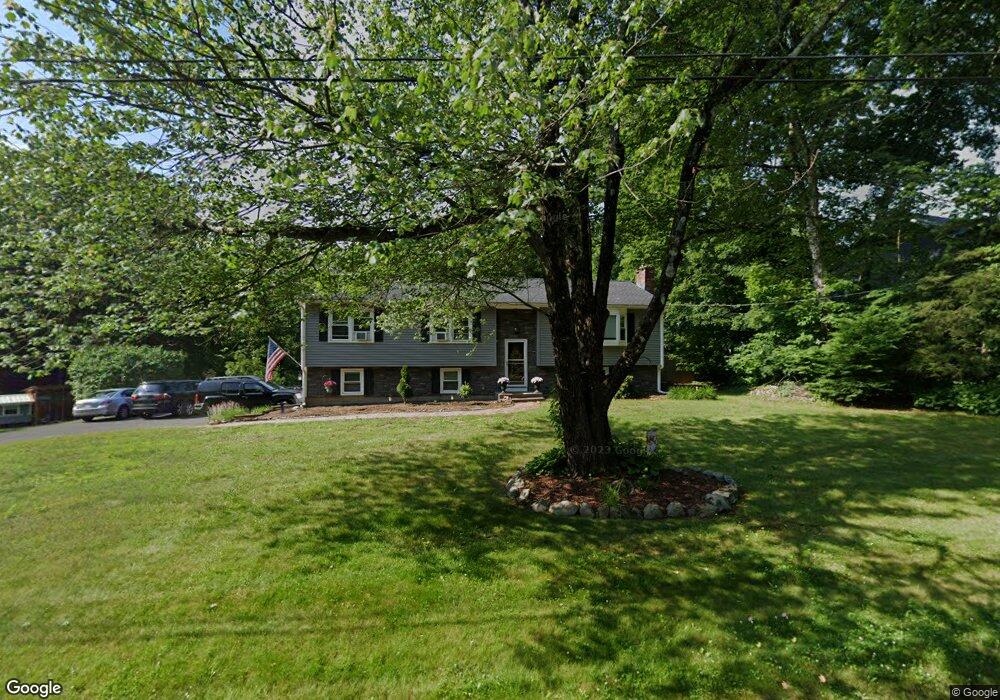
9 Pease St Wilbraham, MA 01095
Estimated Value: $282,366 - $528,000
3
Beds
2
Baths
1,434
Sq Ft
$295/Sq Ft
Est. Value
About This Home
This home is located at 9 Pease St, Wilbraham, MA 01095 and is currently estimated at $422,592, approximately $294 per square foot. 9 Pease St is a home located in Hampden County with nearby schools including Minnechaug Regional High School and Wilbraham & Monson Academy.
Ownership History
Date
Name
Owned For
Owner Type
Purchase Details
Closed on
Apr 30, 2008
Sold by
Tinnirella James A and Tinnirella Lisa M
Bought by
Fopp Stephen R and Fopp Dawn
Current Estimated Value
Home Financials for this Owner
Home Financials are based on the most recent Mortgage that was taken out on this home.
Original Mortgage
$224,000
Interest Rate
5.99%
Mortgage Type
Purchase Money Mortgage
Purchase Details
Closed on
Apr 14, 2000
Sold by
Ridenour Elizabeth J
Bought by
Tinnirella James A and Tinnirella Lisa M
Home Financials for this Owner
Home Financials are based on the most recent Mortgage that was taken out on this home.
Original Mortgage
$163,400
Interest Rate
8.26%
Mortgage Type
Purchase Money Mortgage
Create a Home Valuation Report for This Property
The Home Valuation Report is an in-depth analysis detailing your home's value as well as a comparison with similar homes in the area
Home Values in the Area
Average Home Value in this Area
Purchase History
| Date | Buyer | Sale Price | Title Company |
|---|---|---|---|
| Fopp Stephen R | $280,000 | -- | |
| Tinnirella James A | $172,000 | -- |
Source: Public Records
Mortgage History
| Date | Status | Borrower | Loan Amount |
|---|---|---|---|
| Open | Tinnirella James A | $223,500 | |
| Closed | Fopp Stephen R | $224,000 | |
| Previous Owner | Tinnirella James A | $164,500 | |
| Previous Owner | Tinnirella James A | $163,400 |
Source: Public Records
Tax History Compared to Growth
Tax History
| Year | Tax Paid | Tax Assessment Tax Assessment Total Assessment is a certain percentage of the fair market value that is determined by local assessors to be the total taxable value of land and additions on the property. | Land | Improvement |
|---|---|---|---|---|
| 2025 | $1,806 | $101,000 | $97,000 | $4,000 |
| 2024 | $5,628 | $304,200 | $97,000 | $207,200 |
| 2023 | $5,147 | $290,200 | $97,000 | $193,200 |
| 2022 | $5,147 | $251,200 | $97,000 | $154,200 |
| 2021 | $5,320 | $231,700 | $115,000 | $116,700 |
| 2020 | $5,185 | $231,700 | $115,000 | $116,700 |
| 2019 | $5,051 | $231,700 | $115,000 | $116,700 |
| 2018 | $5,085 | $224,600 | $115,000 | $109,600 |
| 2017 | $4,941 | $224,600 | $115,000 | $109,600 |
| 2016 | $4,912 | $227,400 | $127,500 | $99,900 |
| 2015 | $4,748 | $227,400 | $127,500 | $99,900 |
Source: Public Records
Map
Nearby Homes
- 20 Old Orchard Rd
- 79 High Pine Cir
- 69 High Pine Cir
- 54 High Pine Cir
- 2 Vista Rd
- 2 Bayberry Dr Unit 51
- 28 Decorie Dr
- 474 Mountain Rd
- 35 Lake Dr
- 474-480 Mountain Rd
- 4 Hillcrest Dr
- 8 Patriot Ridge Ln
- 46 Washington Rd
- 182 Mountain Rd
- 6 Hilltop Park
- 12 Highridge Rd
- 6 Teak Terrace Unit 24
- 603 Glendale Rd
- 68 Monson Rd
- 99 Sandalwood Dr Unit site 00