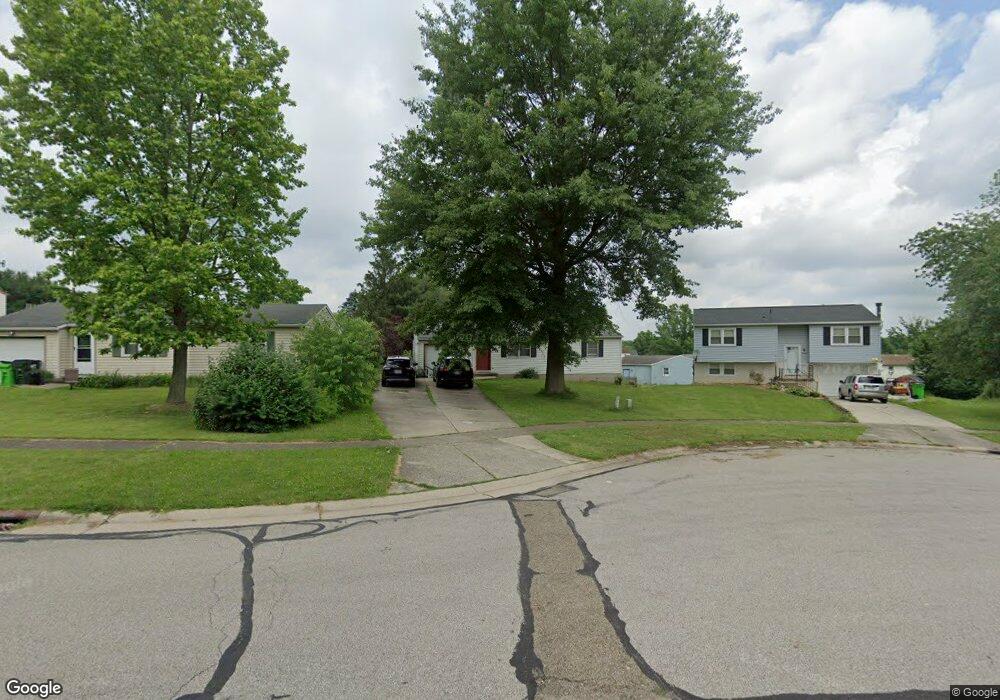
9 Pebble Cove Rittman, OH 44270
Estimated Value: $176,780 - $201,000
3
Beds
1
Bath
864
Sq Ft
$215/Sq Ft
Est. Value
About This Home
This home is located at 9 Pebble Cove, Rittman, OH 44270 and is currently estimated at $185,695, approximately $214 per square foot. 9 Pebble Cove is a home located in Wayne County with nearby schools including Rittman Elementary School, Rittman Middle School, and Rittman High School.
Ownership History
Date
Name
Owned For
Owner Type
Purchase Details
Closed on
Nov 9, 2020
Sold by
Shorter David and Phillips Dianah
Bought by
Shorter Avery and Shorter Hannah
Current Estimated Value
Home Financials for this Owner
Home Financials are based on the most recent Mortgage that was taken out on this home.
Original Mortgage
$112,917
Outstanding Balance
$100,660
Interest Rate
2.9%
Mortgage Type
New Conventional
Estimated Equity
$85,035
Purchase Details
Closed on
May 1, 2007
Sold by
Gadoury Cynthia Marie
Bought by
Shorter David and Phillips Dianah
Home Financials for this Owner
Home Financials are based on the most recent Mortgage that was taken out on this home.
Original Mortgage
$99,216
Interest Rate
6.2%
Mortgage Type
FHA
Purchase Details
Closed on
Feb 20, 1998
Sold by
Moon Charles E
Bought by
Gadoury Cynthia M
Purchase Details
Closed on
Oct 30, 1992
Sold by
Cartwright Edna R
Bought by
Moon Charles E and Moon Robin L
Purchase Details
Closed on
Jul 21, 1987
Bought by
Cartwright Edna R
Create a Home Valuation Report for This Property
The Home Valuation Report is an in-depth analysis detailing your home's value as well as a comparison with similar homes in the area
Home Values in the Area
Average Home Value in this Area
Purchase History
| Date | Buyer | Sale Price | Title Company |
|---|---|---|---|
| Shorter Avery | $115,000 | Title Alliance Of Northeast | |
| Shorter David | $100,000 | Barristers Title Agency | |
| Gadoury Cynthia M | $74,900 | -- | |
| Moon Charles E | $54,000 | -- | |
| Cartwright Edna R | $11,000 | -- |
Source: Public Records
Mortgage History
| Date | Status | Borrower | Loan Amount |
|---|---|---|---|
| Open | Shorter Avery | $112,917 | |
| Closed | Shorter David | $99,216 |
Source: Public Records
Tax History Compared to Growth
Tax History
| Year | Tax Paid | Tax Assessment Tax Assessment Total Assessment is a certain percentage of the fair market value that is determined by local assessors to be the total taxable value of land and additions on the property. | Land | Improvement |
|---|---|---|---|---|
| 2024 | $2,061 | $50,170 | $11,200 | $38,970 |
| 2023 | $2,061 | $50,170 | $11,200 | $38,970 |
| 2022 | $1,638 | $35,580 | $7,940 | $27,640 |
| 2021 | $1,665 | $35,580 | $7,940 | $27,640 |
| 2020 | $1,699 | $35,580 | $7,940 | $27,640 |
| 2019 | $1,605 | $32,060 | $8,050 | $24,010 |
| 2018 | $1,618 | $32,060 | $8,050 | $24,010 |
| 2017 | $1,720 | $32,060 | $8,050 | $24,010 |
| 2016 | $1,698 | $30,820 | $7,740 | $23,080 |
| 2015 | $1,675 | $30,820 | $7,740 | $23,080 |
| 2014 | $1,671 | $30,820 | $7,740 | $23,080 |
| 2013 | $1,725 | $32,050 | $7,860 | $24,190 |
Source: Public Records
Map
Nearby Homes