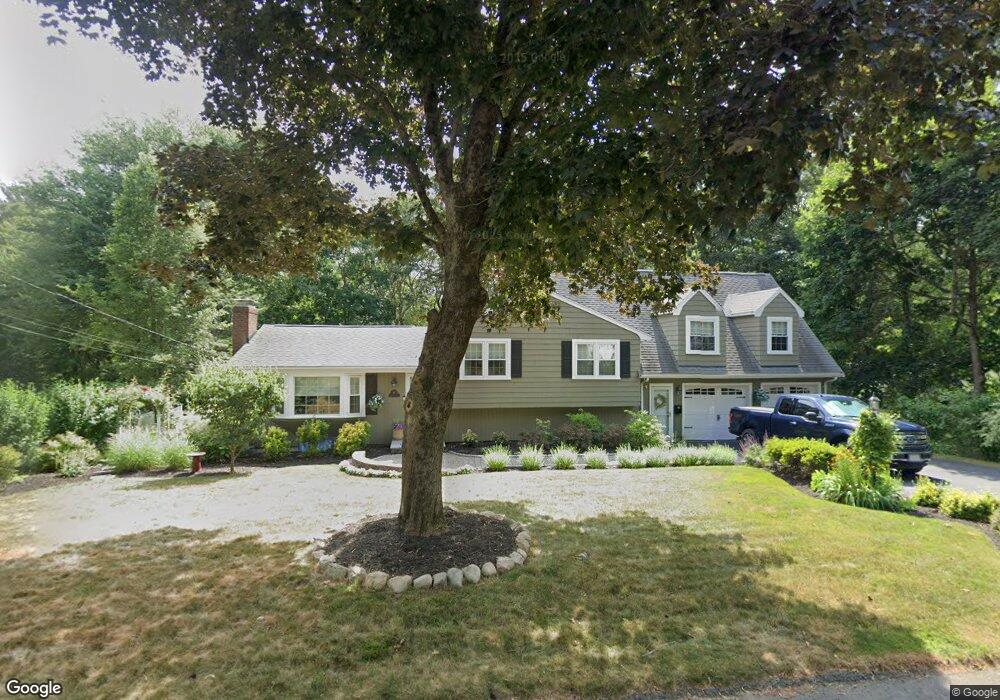
9 Phyllis Rd Foxboro, MA 02035
Estimated Value: $686,964 - $943,000
4
Beds
3
Baths
1,875
Sq Ft
$424/Sq Ft
Est. Value
About This Home
This home is located at 9 Phyllis Rd, Foxboro, MA 02035 and is currently estimated at $794,991, approximately $423 per square foot. 9 Phyllis Rd is a home located in Norfolk County with nearby schools including Foxborough High School, Foxborough Regional Charter School, and The Sage School.
Ownership History
Date
Name
Owned For
Owner Type
Purchase Details
Closed on
Mar 21, 2007
Sold by
Crosby Joseph F
Bought by
Crosby Joseph F and Crosby Nancy M
Current Estimated Value
Purchase Details
Closed on
Apr 27, 2001
Sold by
Michaud Jean P and Michaud Sandra J
Bought by
Crosby Joseph F
Purchase Details
Closed on
May 24, 1988
Sold by
Weiss Robert F
Bought by
Michaud Jean P
Create a Home Valuation Report for This Property
The Home Valuation Report is an in-depth analysis detailing your home's value as well as a comparison with similar homes in the area
Home Values in the Area
Average Home Value in this Area
Purchase History
| Date | Buyer | Sale Price | Title Company |
|---|---|---|---|
| Crosby Joseph F | -- | -- | |
| Crosby Joseph F | $360,000 | -- | |
| Michaud Jean P | $169,000 | -- |
Source: Public Records
Mortgage History
| Date | Status | Borrower | Loan Amount |
|---|---|---|---|
| Open | Michaud Jean P | $135,000 | |
| Closed | Michaud Jean P | $82,000 |
Source: Public Records
Tax History
| Year | Tax Paid | Tax Assessment Tax Assessment Total Assessment is a certain percentage of the fair market value that is determined by local assessors to be the total taxable value of land and additions on the property. | Land | Improvement |
|---|---|---|---|---|
| 2025 | $8,191 | $619,600 | $238,900 | $380,700 |
| 2024 | $7,343 | $543,500 | $243,300 | $300,200 |
| 2023 | $7,136 | $502,200 | $231,700 | $270,500 |
| 2022 | $6,374 | $439,000 | $194,200 | $244,800 |
| 2021 | $6,119 | $415,100 | $179,900 | $235,200 |
| 2020 | $6,048 | $415,100 | $179,900 | $235,200 |
| 2019 | $5,485 | $373,100 | $171,300 | $201,800 |
| 2018 | $5,266 | $361,400 | $171,300 | $190,100 |
| 2017 | $5,267 | $350,200 | $160,100 | $190,100 |
| 2016 | $5,208 | $351,400 | $161,300 | $190,100 |
| 2015 | $4,960 | $326,500 | $136,400 | $190,100 |
| 2014 | $4,761 | $317,600 | $127,500 | $190,100 |
Source: Public Records
Map
Nearby Homes
- 22 Villa Dr
- 147 Chestnut St Unit A
- 147 Chestnut St Unit B
- 165 Chestnut St Unit 2
- 26 Fuller Rd Unit 6
- 13 Summerville Rd Unit 13
- 24 Eastman Ave
- 1 Maura Elizabeth Ln
- 2 Eisenhauer
- 73 Ridge Rd
- 14 Baker St
- 1 Roseland St Unit B-14
- 54 Main St Unit A
- 157 Central St
- 9 Independence Dr Unit 9
- 84 South St
- 233 Central St
- 6 Cross St
- 120 Beach St
- 668 S Main St
Your Personal Tour Guide
Ask me questions while you tour the home.