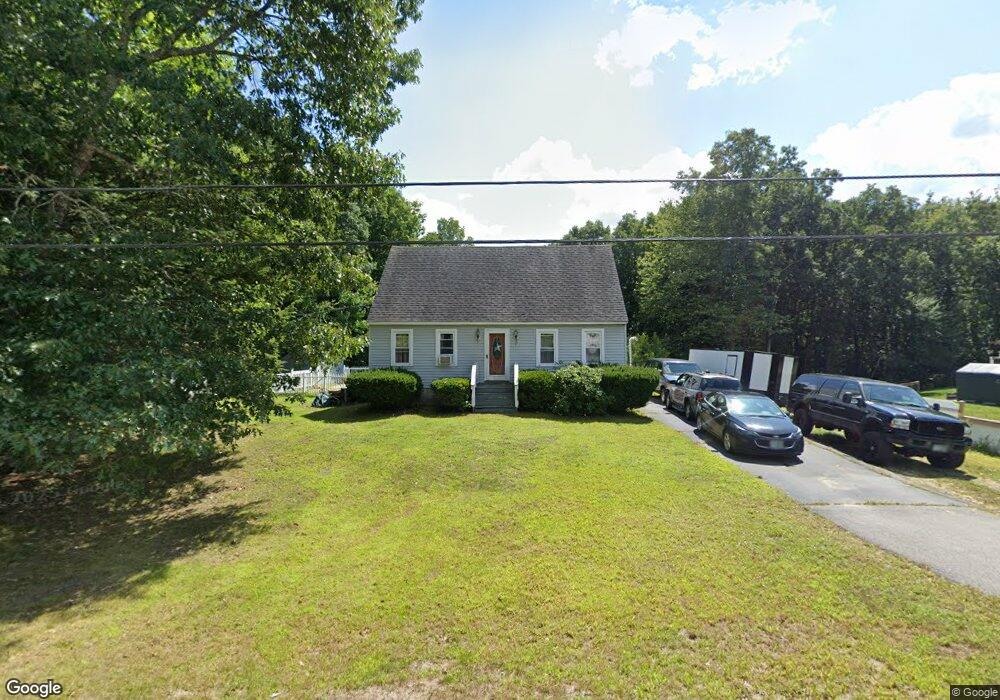
9 Pierce Rd Raymond, NH 03077
Estimated Value: $447,210 - $475,000
3
Beds
3
Baths
1,469
Sq Ft
$314/Sq Ft
Est. Value
About This Home
This home is located at 9 Pierce Rd, Raymond, NH 03077 and is currently estimated at $461,053, approximately $313 per square foot. 9 Pierce Rd is a home located in Rockingham County with nearby schools including Lamprey River Elementary School, Iber Holmes Gove Middle School, and Raymond High School.
Ownership History
Date
Name
Owned For
Owner Type
Purchase Details
Closed on
Feb 27, 2006
Sold by
Husson Clifford K and Husson Susan G
Bought by
Mclaughlin Richard and Mclaughlin Mary
Current Estimated Value
Home Financials for this Owner
Home Financials are based on the most recent Mortgage that was taken out on this home.
Original Mortgage
$217,600
Outstanding Balance
$121,583
Interest Rate
6.17%
Mortgage Type
Purchase Money Mortgage
Estimated Equity
$339,470
Create a Home Valuation Report for This Property
The Home Valuation Report is an in-depth analysis detailing your home's value as well as a comparison with similar homes in the area
Home Values in the Area
Average Home Value in this Area
Purchase History
| Date | Buyer | Sale Price | Title Company |
|---|---|---|---|
| Mclaughlin Richard | $272,000 | -- |
Source: Public Records
Mortgage History
| Date | Status | Borrower | Loan Amount |
|---|---|---|---|
| Open | Mclaughlin Richard | $217,600 |
Source: Public Records
Tax History
| Year | Tax Paid | Tax Assessment Tax Assessment Total Assessment is a certain percentage of the fair market value that is determined by local assessors to be the total taxable value of land and additions on the property. | Land | Improvement |
|---|---|---|---|---|
| 2025 | $6,587 | $286,900 | $114,600 | $172,300 |
| 2024 | $6,286 | $286,900 | $114,600 | $172,300 |
| 2023 | $5,945 | $286,900 | $114,600 | $172,300 |
| 2022 | $5,247 | $286,900 | $114,600 | $172,300 |
| 2021 | $5,311 | $286,900 | $114,600 | $172,300 |
| 2020 | $5,515 | $210,500 | $82,100 | $128,400 |
| 2019 | $5,597 | $210,500 | $82,100 | $128,400 |
| 2018 | $5,547 | $210,500 | $82,100 | $128,400 |
| 2017 | $5,094 | $210,500 | $82,100 | $128,400 |
| 2016 | $4,997 | $210,500 | $82,100 | $128,400 |
| 2015 | $4,898 | $195,300 | $82,100 | $113,200 |
| 2014 | $4,752 | $195,300 | $82,100 | $113,200 |
| 2013 | $4,674 | $197,700 | $82,100 | $115,600 |
Source: Public Records
Map
Nearby Homes
- 0 Eastside Dr Unit 33
- 14 Mica Dr Unit 3
- 22 Mica Dr Unit 7
- 10 Mica Dr Unit 1
- 12 Mica Dr Unit 2
- 16 Mica Dr Unit 4
- 20 Mica Dr Unit 6
- 17 Mica Dr Unit 11
- 15 Mica Dr Unit 12
- 0 Taft Way Unit 4
- 5 Blaisdell Ct
- 10 Blaisdell Ct
- 13 Blaisdell Ct Unit 10
- 12-19 Dump Rd
- 14 Main St
- 3 Autumn Ln
- 38 Lane Rd
- 5 Autumn Ln
- 15 Autumn Ln
- 209 New Hampshire 27
Your Personal Tour Guide
Ask me questions while you tour the home.