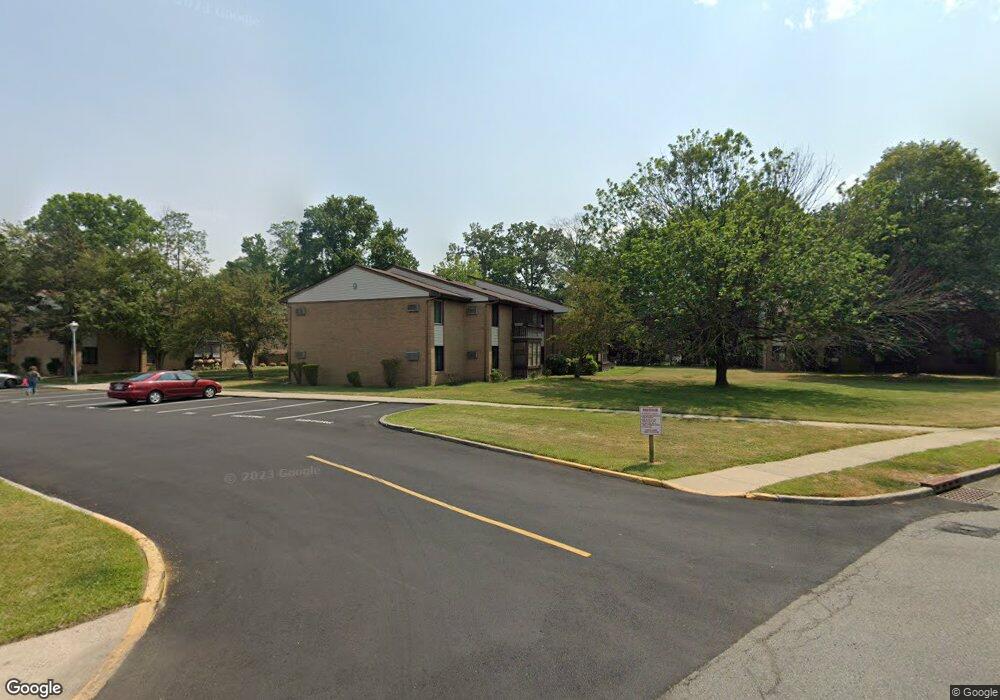
9 Pine Cluster Cir Unit J Manalapan, NJ 07726
Estimated Value: $260,704 - $302,000
2
Beds
2
Baths
1,130
Sq Ft
$242/Sq Ft
Est. Value
About This Home
This home is located at 9 Pine Cluster Cir Unit J, Manalapan, NJ 07726 and is currently estimated at $273,176, approximately $241 per square foot. 9 Pine Cluster Cir Unit J is a home located in Monmouth County with nearby schools including Milford Brook Elementary School, Pine Brook Elementary School, and Manalapan-Englishtown Middle School.
Ownership History
Date
Name
Owned For
Owner Type
Purchase Details
Closed on
Jul 10, 2024
Sold by
Serramonte Realty Llc
Bought by
Mendelson Wayne and Mendelson Deborah
Current Estimated Value
Purchase Details
Closed on
Jun 29, 2021
Sold by
Bolen Lisa and Estate Of Brian Healy
Bought by
Serramonte Realty Llc
Purchase Details
Closed on
Feb 20, 2013
Sold by
Sanicola Rochelle
Bought by
Healy Brian
Home Financials for this Owner
Home Financials are based on the most recent Mortgage that was taken out on this home.
Original Mortgage
$75,000
Interest Rate
3.58%
Mortgage Type
New Conventional
Purchase Details
Closed on
Oct 31, 1996
Sold by
Schoen Richard
Bought by
Sanicola Rochelle
Home Financials for this Owner
Home Financials are based on the most recent Mortgage that was taken out on this home.
Original Mortgage
$40,000
Interest Rate
7.99%
Create a Home Valuation Report for This Property
The Home Valuation Report is an in-depth analysis detailing your home's value as well as a comparison with similar homes in the area
Home Values in the Area
Average Home Value in this Area
Purchase History
| Date | Buyer | Sale Price | Title Company |
|---|---|---|---|
| Mendelson Wayne | $220,000 | Afrm Title & Abstract | |
| Mendelson Wayne | $220,000 | Afrm Title & Abstract | |
| Serramonte Realty Llc | $185,000 | First Choice Title Agency | |
| Healy Brian | $95,000 | None Available | |
| Sanicola Rochelle | $66,000 | -- |
Source: Public Records
Mortgage History
| Date | Status | Borrower | Loan Amount |
|---|---|---|---|
| Previous Owner | Healy Brian | $75,000 | |
| Previous Owner | Sanicola Rochelle | $40,000 |
Source: Public Records
Tax History Compared to Growth
Tax History
| Year | Tax Paid | Tax Assessment Tax Assessment Total Assessment is a certain percentage of the fair market value that is determined by local assessors to be the total taxable value of land and additions on the property. | Land | Improvement |
|---|---|---|---|---|
| 2025 | $4,166 | $240,100 | $90,000 | $150,100 |
| 2024 | $3,624 | $246,800 | $115,000 | $131,800 |
| 2023 | $3,624 | $217,800 | $89,000 | $128,800 |
| 2022 | $1,354 | $201,600 | $79,000 | $122,600 |
| 2021 | $3,047 | $65,200 | $44,000 | $21,200 |
| 2020 | $3,047 | $148,400 | $40,000 | $108,400 |
| 2019 | $2,589 | $126,000 | $23,000 | $103,000 |
| 2018 | $2,505 | $121,200 | $23,000 | $98,200 |
| 2017 | $2,562 | $124,000 | $30,000 | $94,000 |
| 2016 | $2,405 | $117,800 | $25,000 | $92,800 |
| 2015 | $2,444 | $118,400 | $28,000 | $90,400 |
| 2014 | $1,863 | $87,900 | $18,000 | $69,900 |
Source: Public Records
Map
Nearby Homes
- 54 Amberly Dr Unit G
- 55 Amberly Dr Unit G
- 108 Amberly Dr Unit D
- 24 Meadow Green Cir Unit A
- 34 Sherwood Rd
- 519 Union Hill Rd
- 521 Union Hill Rd
- 0-0 Union Hill Rd
- 26 Meadow Green Cir Unit K
- 544 Union Hill Rd
- 167 Amberly Dr Unit H
- 86 Arrowood Rd Unit B
- 75 Overlook Way Unit K
- 29 Meadow Green Cir Unit A
- 30 Meadow Green Cir Unit E
- 70 Overlook Way Unit E
- 162 Cross Slope Ct Unit K
- 150 Amberly Dr Unit A
- 131 Amberly Dr Unit J
- 11 Rowena Rd
- 9 Pine Cluster Cir
- 9 Pine Cluster Cir Unit C
- 9 Pine Cluster Cir Unit E
- 9 Pine Cluster Cir Unit D
- 9 Pine Cluster Cir Unit G
- 9 Pine Cluster Cir Unit H
- 9 Pine Cluster Cir Unit K
- 9 Pine Cluster Cir Unit J
- 9 Pine Cluster Cir Unit F
- 9 Pine Cluster Cir Unit B
- 9 Pine Cluster Cir
- 10 Pine Cluster Cir Unit D
- 10 Pine Cluster Cir Unit J
- 10 Pine Cluster Cir Unit C
- 10 Pine Cluster Cir Unit E
- 10 Pine Cluster Cir Unit A
- 10 Pine Cluster Cir Unit K
- 10 Pine Cluster Cir Unit B
- 10 Pine Cluster Cir Unit H
- 10 Pine Cluster Cir Unit G