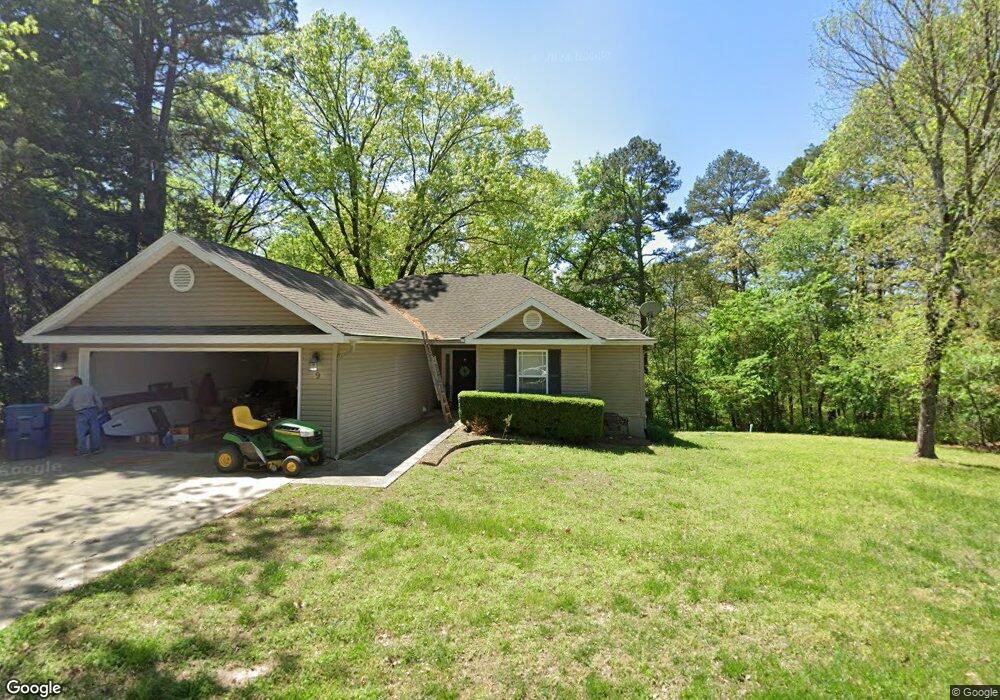
9 Pitchford Ln Bella Vista, AR 72714
Estimated Value: $283,000 - $317,000
3
Beds
2
Baths
1,326
Sq Ft
$227/Sq Ft
Est. Value
About This Home
This home is located at 9 Pitchford Ln, Bella Vista, AR 72714 and is currently estimated at $301,053, approximately $227 per square foot. 9 Pitchford Ln is a home located in Benton County with nearby schools including Cooper Elementary School, Old High Middle School, and Washington Junior High School.
Ownership History
Date
Name
Owned For
Owner Type
Purchase Details
Closed on
Apr 6, 2007
Sold by
Pro Build Inc
Bought by
Brown Jenny D
Current Estimated Value
Home Financials for this Owner
Home Financials are based on the most recent Mortgage that was taken out on this home.
Original Mortgage
$136,350
Outstanding Balance
$82,033
Interest Rate
6.15%
Mortgage Type
Purchase Money Mortgage
Estimated Equity
$219,020
Purchase Details
Closed on
Dec 12, 2005
Sold by
Fredericksen Summer and Fredericksen Keith
Bought by
Pro Build Inc
Purchase Details
Closed on
Oct 27, 2005
Sold by
Bella Vista Village Property Owners Asso
Bought by
Fredericksen Summer
Purchase Details
Closed on
Oct 15, 2004
Bought by
Bvpoa
Purchase Details
Closed on
Aug 6, 1980
Bought by
Jones
Create a Home Valuation Report for This Property
The Home Valuation Report is an in-depth analysis detailing your home's value as well as a comparison with similar homes in the area
Home Values in the Area
Average Home Value in this Area
Purchase History
| Date | Buyer | Sale Price | Title Company |
|---|---|---|---|
| Brown Jenny D | $137,000 | None Available | |
| Pro Build Inc | -- | None Available | |
| Fredericksen Summer | $13,000 | None Available | |
| Bvpoa | -- | -- | |
| Jones | -- | -- |
Source: Public Records
Mortgage History
| Date | Status | Borrower | Loan Amount |
|---|---|---|---|
| Open | Brown Jenny D | $136,350 |
Source: Public Records
Tax History Compared to Growth
Tax History
| Year | Tax Paid | Tax Assessment Tax Assessment Total Assessment is a certain percentage of the fair market value that is determined by local assessors to be the total taxable value of land and additions on the property. | Land | Improvement |
|---|---|---|---|---|
| 2025 | $2,080 | $46,809 | $1,600 | $45,209 |
| 2024 | $1,887 | $46,809 | $1,600 | $45,209 |
| 2023 | $1,716 | $31,120 | $800 | $30,320 |
| 2022 | $1,249 | $31,120 | $800 | $30,320 |
| 2021 | $1,171 | $31,120 | $800 | $30,320 |
| 2020 | $1,110 | $23,320 | $600 | $22,720 |
| 2019 | $1,110 | $23,320 | $600 | $22,720 |
| 2018 | $1,135 | $23,320 | $600 | $22,720 |
| 2017 | $1,065 | $23,320 | $600 | $22,720 |
| 2016 | $1,065 | $23,320 | $600 | $22,720 |
| 2015 | $1,326 | $21,990 | $1,000 | $20,990 |
| 2014 | $976 | $21,990 | $1,000 | $20,990 |
Source: Public Records
Map
Nearby Homes
- 99 Buckingham Dr
- Lot 29 Wychwood Ln
- Lot 25 Leafield Ln
- 3 Fenchurch Ln
- 25 Everleigh Dr
- 0 Kirkwall and Copinsay Unit 1322488
- 13 Fenchurch Dr
- 8 Rayburn Dr
- 5 Ashburton Ln
- 6 Banbury Ln
- 41 Buckingham Dr
- 6 Devizis Dr
- 17 Devizis Dr
- 8 Elizabeth Dr
- 24 Hallock Dr
- 0 Deddington Dr
- 1 Brighstone Ln
- 11 Wolviston Cir
- 6 Condry Ln
- 6 Hallock Dr
- L9 Pitchford Ln
- 902 Pitchford Ln
- 6 Pitchford Ln
- 5 Pitchford Ln
- ----- Pitchford Ln
- L8 Pitchford Ln
- 1933 Pitchford Ln
- 1100 Pitchford Ln
- 17441 Pitchford Ln
- - Pitchford Ln
- 0 Pitchford Ln
- Lot 6 Wood Ln
- 10 Pitchford Ln
- 7 Wood Ln
- Lot 3 & 4 Wood Ln
- 106 Buckingham Dr
- 112 Buckingham Dr
- 10 Pitchford Ln
- Lot 6 Block 10 Wood Ln
- -- Pitchford L11