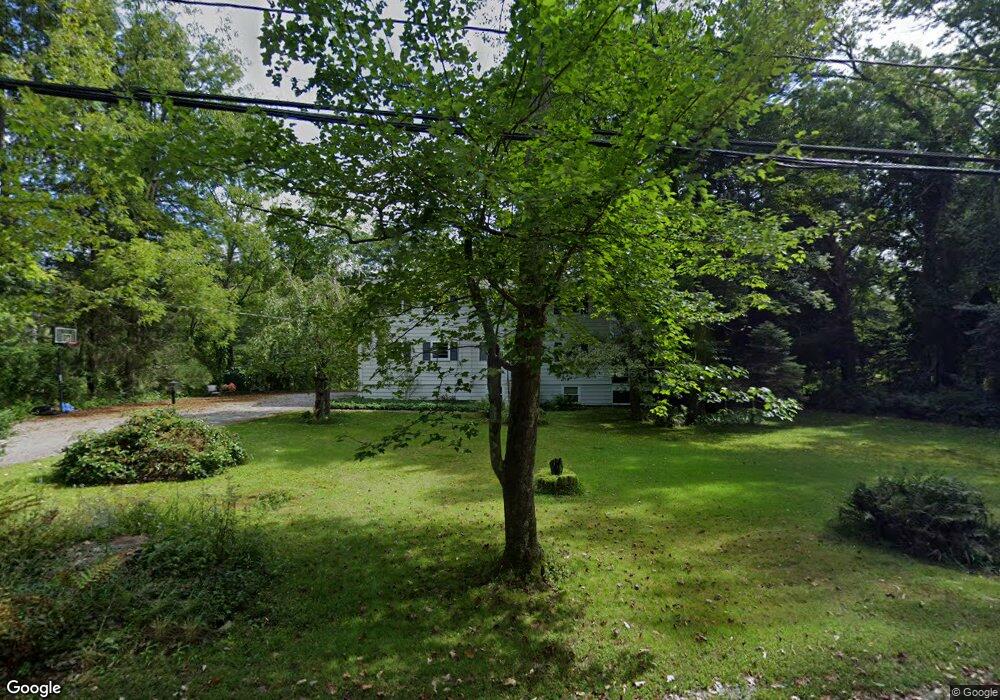
9 Pleasant St Sherborn, MA 01770
Estimated Value: $900,000 - $1,194,000
4
Beds
4
Baths
2,081
Sq Ft
$495/Sq Ft
Est. Value
About This Home
This home is located at 9 Pleasant St, Sherborn, MA 01770 and is currently estimated at $1,029,493, approximately $494 per square foot. 9 Pleasant St is a home located in Middlesex County with nearby schools including Pine Hill Elementary School, Dover-Sherborn Regional Middle School, and Dover-Sherborn Regional High School.
Ownership History
Date
Name
Owned For
Owner Type
Purchase Details
Closed on
Dec 29, 1992
Sold by
Rooney Albert K
Bought by
Purins Erik P and Vehvilainen Laila
Current Estimated Value
Home Financials for this Owner
Home Financials are based on the most recent Mortgage that was taken out on this home.
Original Mortgage
$221,400
Interest Rate
8.31%
Mortgage Type
Purchase Money Mortgage
Create a Home Valuation Report for This Property
The Home Valuation Report is an in-depth analysis detailing your home's value as well as a comparison with similar homes in the area
Home Values in the Area
Average Home Value in this Area
Purchase History
| Date | Buyer | Sale Price | Title Company |
|---|---|---|---|
| Purins Erik P | $246,000 | -- |
Source: Public Records
Mortgage History
| Date | Status | Borrower | Loan Amount |
|---|---|---|---|
| Open | Purins Erik P | $182,000 | |
| Closed | Purins Erik P | $221,400 |
Source: Public Records
Tax History Compared to Growth
Tax History
| Year | Tax Paid | Tax Assessment Tax Assessment Total Assessment is a certain percentage of the fair market value that is determined by local assessors to be the total taxable value of land and additions on the property. | Land | Improvement |
|---|---|---|---|---|
| 2025 | $13,131 | $792,000 | $428,800 | $363,200 |
| 2024 | $11,636 | $686,500 | $368,900 | $317,600 |
| 2023 | $11,069 | $614,600 | $368,900 | $245,700 |
| 2022 | $10,375 | $545,200 | $357,700 | $187,500 |
| 2021 | $9,740 | $496,200 | $357,700 | $138,500 |
| 2020 | $9,656 | $496,200 | $357,700 | $138,500 |
| 2019 | $8,253 | $494,700 | $357,700 | $137,000 |
| 2018 | $6,904 | $490,800 | $357,700 | $133,100 |
| 2017 | $9,673 | $472,800 | $357,700 | $115,100 |
| 2016 | $9,228 | $448,600 | $335,800 | $112,800 |
| 2015 | $8,876 | $436,800 | $325,900 | $110,900 |
| 2014 | $8,592 | $422,400 | $313,800 | $108,600 |
Source: Public Records
Map
Nearby Homes
- 18 Wildwood Dr
- 61 Old Orchard Rd
- 6 Brook St
- 151 Mohawk Path
- 4 Green Ln
- 2 Surrey Ln
- 1 Adams Rd
- 2 Adams Rd Unit 2
- 9 Adams Rd
- 131 Jennings Rd
- 306 Trailside Way
- 67 Spyglass Hill Dr
- 7 Fawn Rd
- 84 E Bluff Rd
- 195 High St
- 95 Brooksmont Dr Unit 26
- 133 Brooksmont Dr Unit 43
- 63 Trailside Way Unit 63
- 59 Turner Rd
- 32 Colonial Way