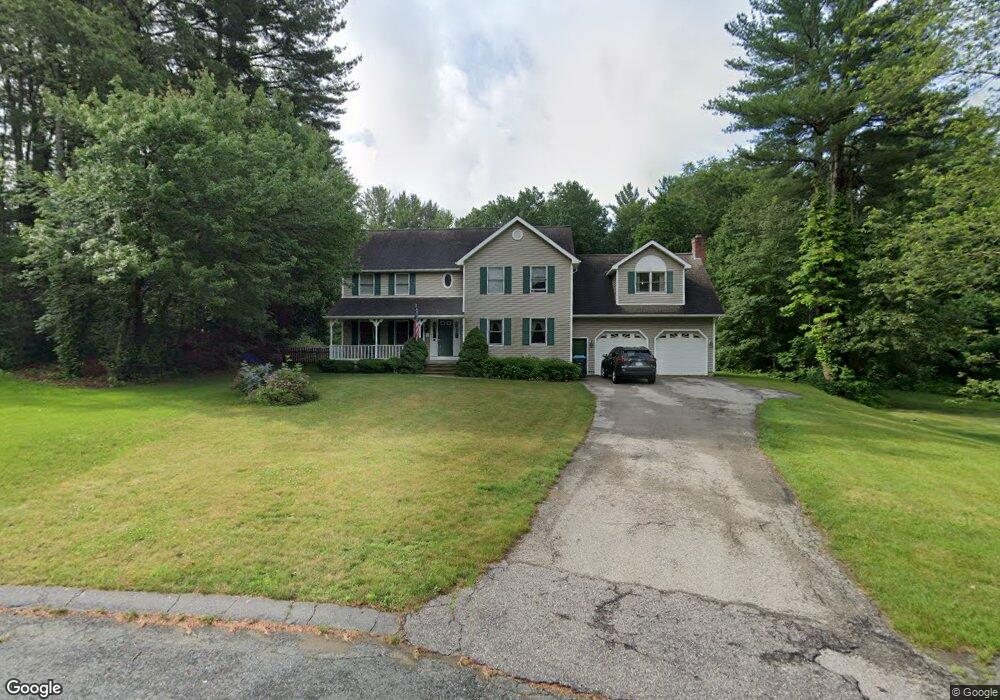
9 Pondville Ct Auburn, MA 01501
Pondville NeighborhoodEstimated Value: $666,000 - $829,000
4
Beds
3
Baths
2,957
Sq Ft
$257/Sq Ft
Est. Value
About This Home
This home is located at 9 Pondville Ct, Auburn, MA 01501 and is currently estimated at $761,340, approximately $257 per square foot. 9 Pondville Ct is a home located in Worcester County with nearby schools including Auburn Senior High School and Shrewsbury Montessori School - Auburn Campus.
Ownership History
Date
Name
Owned For
Owner Type
Purchase Details
Closed on
Apr 19, 2006
Sold by
Lancaster Michael S
Bought by
Lancaster Cheryl L and Lancaster Michael S
Current Estimated Value
Home Financials for this Owner
Home Financials are based on the most recent Mortgage that was taken out on this home.
Original Mortgage
$370,000
Outstanding Balance
$212,135
Interest Rate
6.32%
Mortgage Type
Purchase Money Mortgage
Estimated Equity
$549,205
Purchase Details
Closed on
Mar 31, 2006
Sold by
Malvey John J and Malvey Susan J
Bought by
Lancaster Michael S
Home Financials for this Owner
Home Financials are based on the most recent Mortgage that was taken out on this home.
Original Mortgage
$370,000
Outstanding Balance
$212,135
Interest Rate
6.32%
Mortgage Type
Purchase Money Mortgage
Estimated Equity
$549,205
Create a Home Valuation Report for This Property
The Home Valuation Report is an in-depth analysis detailing your home's value as well as a comparison with similar homes in the area
Home Values in the Area
Average Home Value in this Area
Purchase History
| Date | Buyer | Sale Price | Title Company |
|---|---|---|---|
| Lancaster Cheryl L | -- | -- | |
| Lancaster Michael S | $470,000 | -- |
Source: Public Records
Mortgage History
| Date | Status | Borrower | Loan Amount |
|---|---|---|---|
| Open | Lancaster Michael S | $370,000 |
Source: Public Records
Tax History Compared to Growth
Tax History
| Year | Tax Paid | Tax Assessment Tax Assessment Total Assessment is a certain percentage of the fair market value that is determined by local assessors to be the total taxable value of land and additions on the property. | Land | Improvement |
|---|---|---|---|---|
| 2025 | $88 | $615,000 | $149,800 | $465,200 |
| 2024 | $9,221 | $617,600 | $144,100 | $473,500 |
| 2023 | $8,805 | $554,500 | $131,100 | $423,400 |
| 2022 | $8,116 | $482,500 | $131,100 | $351,400 |
| 2021 | $7,949 | $438,200 | $116,200 | $322,000 |
| 2020 | $7,879 | $438,200 | $116,200 | $322,000 |
| 2019 | $7,766 | $421,600 | $114,000 | $307,600 |
| 2018 | $4,169 | $420,800 | $106,600 | $314,200 |
| 2017 | $7,453 | $406,400 | $96,700 | $309,700 |
| 2016 | $7,249 | $400,700 | $99,800 | $300,900 |
| 2015 | $6,937 | $401,900 | $99,800 | $302,100 |
| 2014 | $6,790 | $392,700 | $95,200 | $297,500 |
Source: Public Records
Map
Nearby Homes