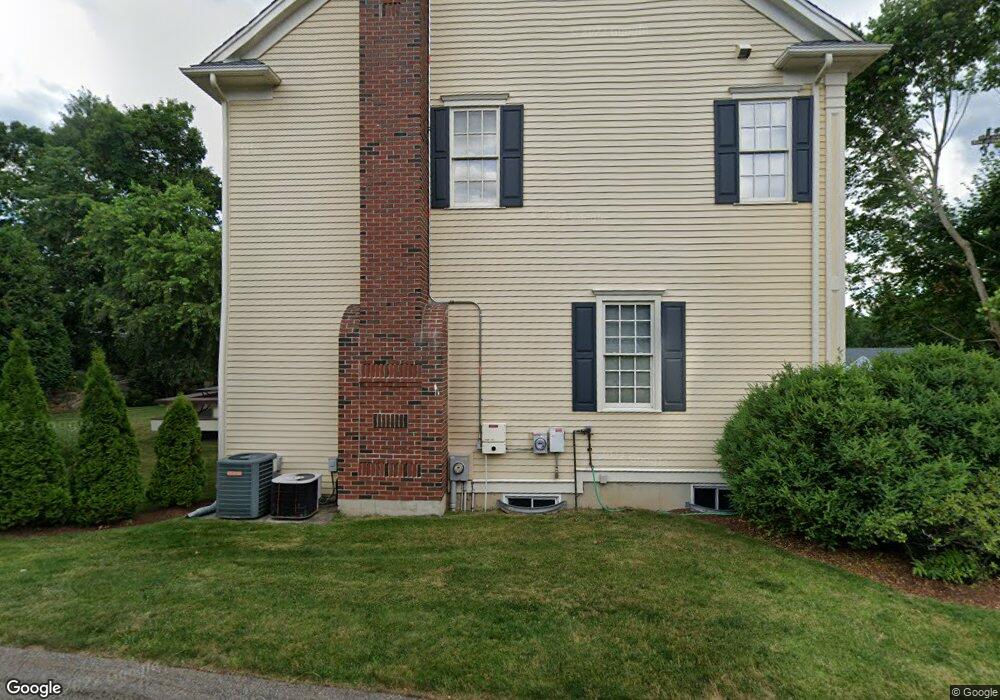
9 Prescott Ave Unit 1 Natick, MA 01760
Estimated Value: $1,367,740 - $1,627,000
4
Beds
3
Baths
4,000
Sq Ft
$383/Sq Ft
Est. Value
About This Home
This home is located at 9 Prescott Ave Unit 1, Natick, MA 01760 and is currently estimated at $1,532,435, approximately $383 per square foot. 9 Prescott Ave Unit 1 is a home located in Middlesex County with nearby schools including Natick High School, J F Kennedy Middle School, and Johnson Elementary School.
Ownership History
Date
Name
Owned For
Owner Type
Purchase Details
Closed on
Sep 1, 2009
Sold by
Wadsworth David P and Wadsworth Deanne G
Bought by
Sweet C Michael and Sweet Jessica
Current Estimated Value
Purchase Details
Closed on
Apr 1, 2005
Sold by
Abdessamad Hicham and Pandya Shuchi
Bought by
Wadsworth David P and Wadsworth Deanne G
Purchase Details
Closed on
Jul 25, 2003
Sold by
Pratt Richard A
Bought by
Pandya Shuchi and Abdessamal Hicham
Purchase Details
Closed on
May 26, 2000
Sold by
B & B Land Corp
Bought by
Pratt Richard A
Purchase Details
Closed on
Mar 22, 1999
Sold by
Natick Town Of
Bought by
B & B Land Corp
Create a Home Valuation Report for This Property
The Home Valuation Report is an in-depth analysis detailing your home's value as well as a comparison with similar homes in the area
Home Values in the Area
Average Home Value in this Area
Purchase History
| Date | Buyer | Sale Price | Title Company |
|---|---|---|---|
| Sweet C Michael | $700,000 | -- | |
| Wadsworth David P | $815,000 | -- | |
| Pandya Shuchi | $687,500 | -- | |
| Pratt Richard A | $175,000 | -- | |
| B & B Land Corp | $48,000 | -- |
Source: Public Records
Mortgage History
| Date | Status | Borrower | Loan Amount |
|---|---|---|---|
| Open | B & B Land Corp | $521,500 | |
| Closed | B & B Land Corp | $36,200 |
Source: Public Records
Tax History
| Year | Tax Paid | Tax Assessment Tax Assessment Total Assessment is a certain percentage of the fair market value that is determined by local assessors to be the total taxable value of land and additions on the property. | Land | Improvement |
|---|---|---|---|---|
| 2025 | $14,743 | $1,232,700 | $433,500 | $799,200 |
| 2024 | $14,285 | $1,165,200 | $410,700 | $754,500 |
| 2023 | $13,109 | $1,037,100 | $383,300 | $653,800 |
| 2022 | $12,838 | $962,400 | $346,800 | $615,600 |
| 2021 | $12,457 | $915,300 | $342,200 | $573,100 |
| 2020 | $12,271 | $901,600 | $328,500 | $573,100 |
| 2019 | $14,397 | $901,600 | $328,500 | $573,100 |
| 2018 | $11,323 | $867,700 | $317,100 | $550,600 |
| 2017 | $11,472 | $850,400 | $309,700 | $540,700 |
| 2016 | $11,472 | $845,400 | $309,700 | $535,700 |
| 2015 | $10,987 | $795,000 | $309,700 | $485,300 |
Source: Public Records
Map
Nearby Homes
- 46 Silver Hill Ln Unit 1
- 36 Silver Hill Ln Unit 21
- 3 Silver Hill Ln Unit 6
- 26 Wellesley Ave Unit B
- 79 Speen St
- 34 Walden Dr Unit 5
- 8 Walden Dr Unit 13
- 5 Lanes End
- 28 Sylvester Rd
- 50 Village Brook Ln Unit 4
- 57 Village Brook Ln Unit 5
- 52 Village Brook Ln Unit 14
- 4 Village Brook Ln
- 4 Village Rock Ln Unit 9
- 21 Village Rock Ln Unit 4
- 9 Village Hill Ln Unit 15
- 5 Village Rock Ln Unit 24
- 29 Village Rock Ln Unit 6
- 27 Stillman St
- 1 Fern St
- 9 Prescott Ave
- 0 Pheasant Hollow L-13b Unit 50319817
- 11 Prescott Ave
- 2 Pheasant Hollow Rd
- 6 Prescott Ave
- 4 Pheasant Hollow Rd
- 9 Sylvia Ave
- 11 Sylvia Ave
- 13 Sylvia Ave
- 15 Prescott Ave
- 3 Prescott Ave
- 5 Sylvia Ave
- 18 Prescott Ave
- 6 Pheasant Hollow Rd
- 10 Sylvia Ave
- 1 Pheasant Hollow Rd
- 12 Sylvia Ave
- 8 Sylvia Ave
- 3 Pheasant Hollow Rd
- 5 Pheasant Hollow Rd
Your Personal Tour Guide
Ask me questions while you tour the home.