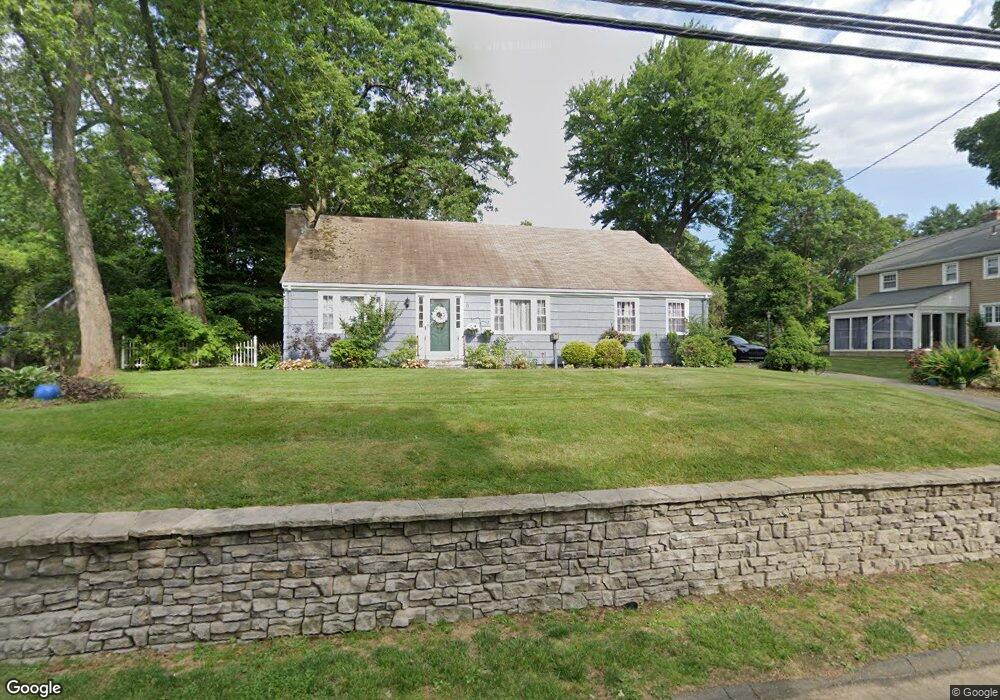
9 Prospect St Bloomfield, CT 06002
Estimated Value: $359,000 - $412,000
3
Beds
3
Baths
2,278
Sq Ft
$169/Sq Ft
Est. Value
About This Home
This home is located at 9 Prospect St, Bloomfield, CT 06002 and is currently estimated at $385,648, approximately $169 per square foot. 9 Prospect St is a home located in Hartford County with nearby schools including Carmen Arace Intermediate School, Metacomet School, and Laurel School.
Ownership History
Date
Name
Owned For
Owner Type
Purchase Details
Closed on
Apr 6, 2020
Sold by
Landell Adlin
Bought by
Landell Simon
Current Estimated Value
Purchase Details
Closed on
Mar 31, 2006
Sold by
Ismail Ali
Bought by
Landell Adlin
Home Financials for this Owner
Home Financials are based on the most recent Mortgage that was taken out on this home.
Original Mortgage
$184,000
Interest Rate
7.95%
Mortgage Type
Purchase Money Mortgage
Purchase Details
Closed on
Mar 2, 1995
Sold by
Fgb Rlty Advisors Inc
Bought by
Lollar Carolyn
Home Financials for this Owner
Home Financials are based on the most recent Mortgage that was taken out on this home.
Original Mortgage
$88,400
Interest Rate
8.96%
Mortgage Type
Purchase Money Mortgage
Purchase Details
Closed on
May 25, 1994
Sold by
Dime Sb Ny
Bought by
Fgb Realty Advisors
Purchase Details
Closed on
Dec 1, 1987
Sold by
Shefaniak Michael
Bought by
Mills Lester
Create a Home Valuation Report for This Property
The Home Valuation Report is an in-depth analysis detailing your home's value as well as a comparison with similar homes in the area
Home Values in the Area
Average Home Value in this Area
Purchase History
| Date | Buyer | Sale Price | Title Company |
|---|---|---|---|
| Landell Simon | -- | None Available | |
| Landell Simon | -- | None Available | |
| Landell Adlin | $230,000 | -- | |
| Landell Adlin | $230,000 | -- | |
| Lollar Carolyn | $110,500 | -- | |
| Lollar Carolyn | $110,500 | -- | |
| Fgb Realty Advisors | $65,500 | -- | |
| Fgb Realty Advisors | $65,500 | -- | |
| Mills Lester | $164,500 | -- |
Source: Public Records
Mortgage History
| Date | Status | Borrower | Loan Amount |
|---|---|---|---|
| Previous Owner | Mills Lester | $184,000 | |
| Previous Owner | Mills Lester | $88,400 |
Source: Public Records
Tax History
| Year | Tax Paid | Tax Assessment Tax Assessment Total Assessment is a certain percentage of the fair market value that is determined by local assessors to be the total taxable value of land and additions on the property. | Land | Improvement |
|---|---|---|---|---|
| 2025 | $7,479 | $199,430 | $46,900 | $152,530 |
| 2024 | $5,958 | $151,830 | $39,270 | $112,560 |
| 2023 | $5,850 | $151,830 | $39,270 | $112,560 |
| 2022 | $5,470 | $151,830 | $39,270 | $112,560 |
| 2021 | $5,592 | $151,830 | $39,270 | $112,560 |
| 2020 | $5,505 | $151,830 | $39,270 | $112,560 |
| 2019 | $5,829 | $150,780 | $39,270 | $111,510 |
| 2018 | $5,837 | $151,130 | $38,500 | $112,630 |
| 2017 | $5,828 | $151,130 | $38,500 | $112,630 |
| 2016 | $5,690 | $151,130 | $38,500 | $112,630 |
| 2015 | $5,584 | $151,130 | $38,500 | $112,630 |
| 2014 | $5,987 | $167,510 | $45,500 | $122,010 |
Source: Public Records
Map
Nearby Homes
- 79 Prospect St
- 6 Spy Glass Cir
- 49 Tyler St
- 13 Hill Farm Rd
- 55 Timberwood Rd
- 25 Hilldale Rd
- 17 Harwich Ln Unit 17
- 81 Silo Way Unit 81
- 256 Park Ave
- 159 School St
- 55 Sunny Reach Dr
- 31 Sutton Place
- 26 Burnwood Dr
- 38 Sutton Place Unit 38
- 12 Filley St
- 99 Oliver Way Unit 99
- 148 King Philip Dr
- 170 Thistle Pond Dr Unit 170
- 162 Thistle Pond Dr
- 171 N Canaan St
Your Personal Tour Guide
Ask me questions while you tour the home.