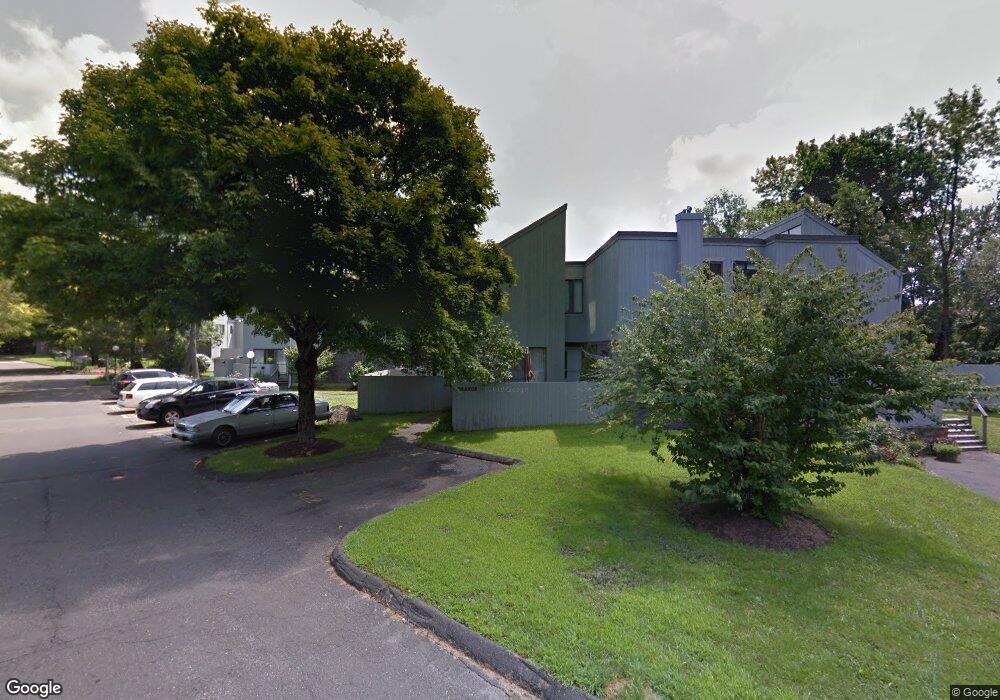
9 Quince Ct Ridgefield, CT 06877
Estimated Value: $303,000 - $325,000
1
Bed
1
Bath
925
Sq Ft
$340/Sq Ft
Est. Value
About This Home
This home is located at 9 Quince Ct, Ridgefield, CT 06877 and is currently estimated at $314,259, approximately $339 per square foot. 9 Quince Ct is a home located in Fairfield County with nearby schools including Barlow Mountain Elementary School, Ridgefield High School, and Ridgefield Montessori School.
Ownership History
Date
Name
Owned For
Owner Type
Purchase Details
Closed on
Sep 23, 2016
Sold by
Wang Jen H and Zhang Gang
Bought by
Hjelte Diiane and Edward Hjelte C
Current Estimated Value
Home Financials for this Owner
Home Financials are based on the most recent Mortgage that was taken out on this home.
Original Mortgage
$100,000
Outstanding Balance
$79,927
Interest Rate
3.45%
Mortgage Type
Purchase Money Mortgage
Estimated Equity
$234,332
Purchase Details
Closed on
Sep 19, 2000
Sold by
Larson Holdings Llc
Bought by
Zhang Gang and Hui-Wang Jen
Home Financials for this Owner
Home Financials are based on the most recent Mortgage that was taken out on this home.
Original Mortgage
$101,250
Interest Rate
8.07%
Purchase Details
Closed on
Mar 8, 2000
Sold by
Patterson Lloyd L and Maxine Patterson H
Bought by
Larson Holdings Llc
Create a Home Valuation Report for This Property
The Home Valuation Report is an in-depth analysis detailing your home's value as well as a comparison with similar homes in the area
Home Values in the Area
Average Home Value in this Area
Purchase History
| Date | Buyer | Sale Price | Title Company |
|---|---|---|---|
| Hjelte Diiane | $140,000 | -- | |
| Zhang Gang | $112,500 | -- | |
| Larson Holdings Llc | $95,000 | -- |
Source: Public Records
Mortgage History
| Date | Status | Borrower | Loan Amount |
|---|---|---|---|
| Open | Larson Holdings Llc | $100,000 | |
| Previous Owner | Larson Holdings Llc | $100,000 | |
| Previous Owner | Larson Holdings Llc | $99,500 | |
| Previous Owner | Larson Holdings Llc | $101,250 |
Source: Public Records
Tax History
| Year | Tax Paid | Tax Assessment Tax Assessment Total Assessment is a certain percentage of the fair market value that is determined by local assessors to be the total taxable value of land and additions on the property. | Land | Improvement |
|---|---|---|---|---|
| 2025 | $3,194 | $116,620 | $0 | $116,620 |
| 2024 | $3,073 | $116,620 | $0 | $116,620 |
| 2023 | $3,010 | $116,620 | $0 | $116,620 |
| 2022 | $2,652 | $93,280 | $0 | $93,280 |
| 2021 | $2,631 | $93,280 | $0 | $93,280 |
| 2020 | $2,623 | $93,280 | $0 | $93,280 |
| 2019 | $2,623 | $93,280 | $0 | $93,280 |
| 2018 | $2,591 | $93,280 | $0 | $93,280 |
| 2017 | $2,838 | $104,300 | $0 | $104,300 |
| 2016 | $2,784 | $104,300 | $0 | $104,300 |
| 2015 | $2,713 | $104,300 | $0 | $104,300 |
| 2014 | $2,713 | $104,300 | $0 | $104,300 |
Source: Public Records
Map
Nearby Homes
- 2 Lemon Ln
- 217 Danbury Rd
- 5 Melon Ln
- 96 Norrans Ridge Dr
- 151 North St
- 9 Dowling Dr
- 55 Olcott Way
- 8 Stebbins Close Unit 8
- 75 Lawson Ln
- 32 Lawson Ln
- 75 New St
- 19 Cook Close Unit 19
- 75A New St
- 77 Sunset Ln Unit 213
- 77 Sunset Ln Unit 223
- 77 Sunset Ln Unit 335
- 59 Prospect St Unit C
- 19 Prospect Ridge Unit 14
- 22 Ketcham Rd
- 26 Abbott Ave
Your Personal Tour Guide
Ask me questions while you tour the home.