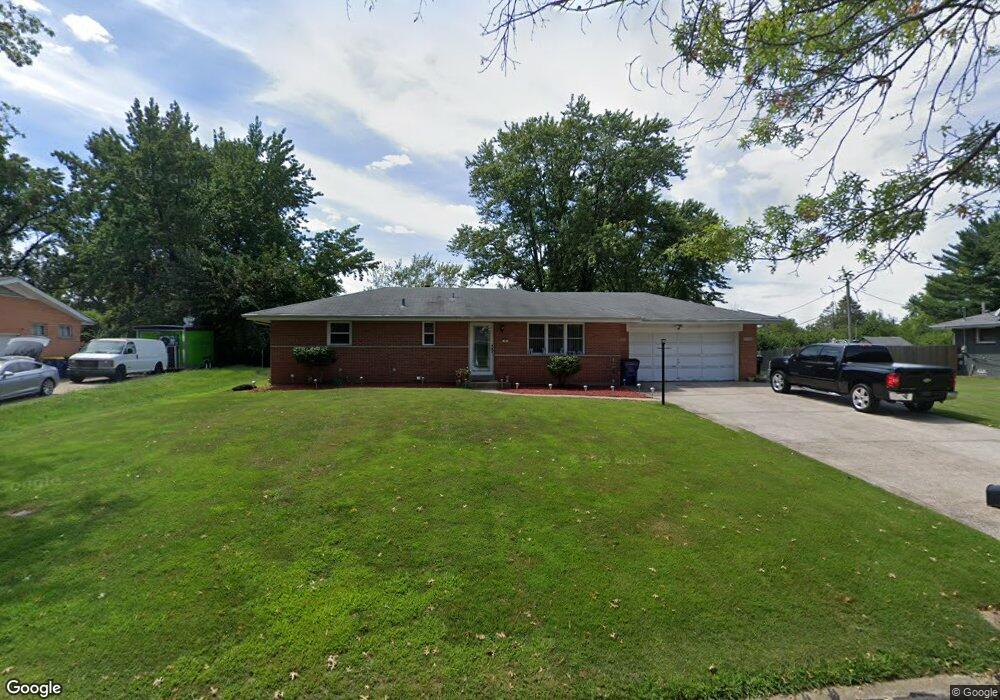
9 Ranchview Dr Florissant, MO 63033
Estimated Value: $147,000 - $166,723
4
Beds
2
Baths
1,056
Sq Ft
$149/Sq Ft
Est. Value
About This Home
This home is located at 9 Ranchview Dr, Florissant, MO 63033 and is currently estimated at $157,431, approximately $149 per square foot. 9 Ranchview Dr is a home located in St. Louis County with nearby schools including Townsend Elementary School, Central Middle School, and Hazelwood Central High School.
Ownership History
Date
Name
Owned For
Owner Type
Purchase Details
Closed on
Aug 31, 2015
Sold by
Bltrejv3 St Louis Llc
Bought by
Csma Blt Llc
Current Estimated Value
Purchase Details
Closed on
May 24, 2013
Sold by
Bardley Sherita
Bought by
Bltrejv3 St Louis Llc
Purchase Details
Closed on
May 19, 2005
Sold by
Bonds Dana D
Bought by
Bardley Sherita
Home Financials for this Owner
Home Financials are based on the most recent Mortgage that was taken out on this home.
Original Mortgage
$98,720
Interest Rate
5.45%
Mortgage Type
Fannie Mae Freddie Mac
Purchase Details
Closed on
Jun 17, 2002
Sold by
Kirsten Robert Lee and Kirsten Carolyn Jean
Bought by
Bonds Dana D
Home Financials for this Owner
Home Financials are based on the most recent Mortgage that was taken out on this home.
Original Mortgage
$102,192
Interest Rate
6.76%
Mortgage Type
FHA
Create a Home Valuation Report for This Property
The Home Valuation Report is an in-depth analysis detailing your home's value as well as a comparison with similar homes in the area
Home Values in the Area
Average Home Value in this Area
Purchase History
We collect this data history from publicly available records. To have your information removed, we recommend requesting removal directly through your county’s website.
| Date | Buyer | Sale Price | Title Company |
|---|---|---|---|
| Csma Blt Llc | $16,670,984 | None Available | |
| Bltrejv3 St Louis Llc | $63,000 | Resolutions Title Inc | |
| Bardley Sherita | $123,400 | Lt | |
| Bonds Dana D | $103,000 | -- |
Source: Public Records
Mortgage History
We collect this data history from publicly available records. To have your information removed, we recommend requesting removal directly through your county’s website.
| Date | Status | Borrower | Loan Amount |
|---|---|---|---|
| Previous Owner | Bardley Sherita | $98,720 | |
| Previous Owner | Bonds Dana D | $102,192 | |
| Closed | Bardley Sherita | $24,680 |
Source: Public Records
Tax History
| Year | Tax Paid | Tax Assessment Tax Assessment Total Assessment is a certain percentage of the fair market value that is determined by local assessors to be the total taxable value of land and additions on the property. | Land | Improvement |
|---|---|---|---|---|
| 2025 | $1,740 | $28,790 | $4,770 | $24,020 |
| 2024 | $1,740 | $19,130 | $4,770 | $14,360 |
| 2023 | $1,734 | $19,130 | $4,770 | $14,360 |
| 2022 | $2,180 | $21,470 | $8,280 | $13,190 |
| 2021 | $2,063 | $21,470 | $8,280 | $13,190 |
| 2020 | $1,906 | $18,460 | $6,190 | $12,270 |
| 2019 | $1,891 | $18,460 | $6,190 | $12,270 |
| 2018 | $1,634 | $14,720 | $4,310 | $10,410 |
| 2017 | $1,632 | $14,720 | $4,310 | $10,410 |
| 2016 | $1,566 | $13,880 | $3,140 | $10,740 |
| 2015 | $1,530 | $13,880 | $3,140 | $10,740 |
| 2014 | $1,536 | $13,870 | $2,870 | $11,000 |
Source: Public Records
Map
Nearby Homes
- 6683 Parker Rd Unit B
- 6670 Chesapeake Dr Unit D
- 6671 Flowerfield Ln Unit B
- 11760 Sheffield Dr
- 11747 Vizcuya Ct
- 11737 Vizcuya Ct
- 11440 Sheffield Dr
- 5 Blossomwood Ct
- 11623 Arroyo Dr
- 6349 Honey Bee Ct
- 12109 La Padera Ln
- 12135 Mignon Dr
- 11754 El Somo Ct
- 12007 Parker Estates Ct
- 12022 Parker Estates Ct
- 12095 El Camara Dr
- 12023 Parker Estates Ct
- 12119 El Camara Dr
- 12034 Parker Estates Ct
- 12027 Parker Estates Ct
Your Personal Tour Guide
Ask me questions while you tour the home.