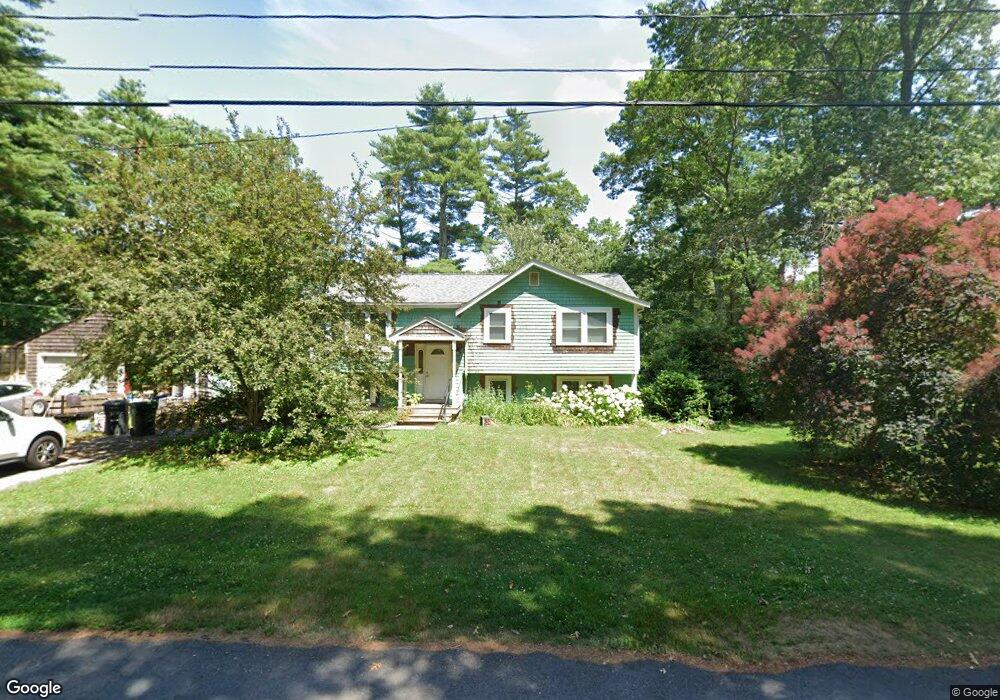
9 Ransom St Carver, MA 02330
Estimated Value: $540,000 - $560,000
3
Beds
1
Bath
1,140
Sq Ft
$482/Sq Ft
Est. Value
About This Home
This home is located at 9 Ransom St, Carver, MA 02330 and is currently estimated at $549,889, approximately $482 per square foot. 9 Ransom St is a home located in Plymouth County with nearby schools including Carver Elementary School, Carver Middle/High School, and Samuel Fuller School.
Ownership History
Date
Name
Owned For
Owner Type
Purchase Details
Closed on
Dec 16, 2011
Sold by
Prouty John B and Prouty Melissa A
Bought by
Coletta Stephen J and Agnew Holly E
Current Estimated Value
Home Financials for this Owner
Home Financials are based on the most recent Mortgage that was taken out on this home.
Original Mortgage
$214,626
Outstanding Balance
$151,952
Interest Rate
4.25%
Mortgage Type
FHA
Estimated Equity
$397,937
Purchase Details
Closed on
Jan 30, 2006
Sold by
Russell William T
Bought by
Prouty John B and Prouty Melissa A
Purchase Details
Closed on
Feb 25, 2004
Sold by
Cardia Jean M and Cardia Joan
Bought by
Russell William T
Purchase Details
Closed on
Sep 1, 2000
Sold by
Malaspino Beverly A and Malaspino Paul N
Bought by
Cardia Jean M and Cardia Joan
Create a Home Valuation Report for This Property
The Home Valuation Report is an in-depth analysis detailing your home's value as well as a comparison with similar homes in the area
Home Values in the Area
Average Home Value in this Area
Purchase History
| Date | Buyer | Sale Price | Title Company |
|---|---|---|---|
| Coletta Stephen J | $205,000 | -- | |
| Prouty John B | $290,000 | -- | |
| Russell William T | -- | -- | |
| Cardia Jean M | $125,000 | -- |
Source: Public Records
Mortgage History
| Date | Status | Borrower | Loan Amount |
|---|---|---|---|
| Open | Coletta Stephen J | $214,626 | |
| Previous Owner | Cardia Jean M | $314,599 | |
| Previous Owner | Cardia Jean M | $15,000 |
Source: Public Records
Tax History
| Year | Tax Paid | Tax Assessment Tax Assessment Total Assessment is a certain percentage of the fair market value that is determined by local assessors to be the total taxable value of land and additions on the property. | Land | Improvement |
|---|---|---|---|---|
| 2025 | $6,513 | $469,600 | $132,500 | $337,100 |
| 2024 | $6,389 | $450,900 | $129,900 | $321,000 |
| 2023 | $6,154 | $421,800 | $129,900 | $291,900 |
| 2022 | $5,860 | $366,700 | $111,000 | $255,700 |
| 2021 | $5,612 | $331,300 | $99,100 | $232,200 |
| 2020 | $5,360 | $311,800 | $92,700 | $219,100 |
| 2019 | $5,217 | $306,000 | $90,000 | $216,000 |
| 2018 | $4,905 | $278,200 | $90,000 | $188,200 |
| 2017 | $4,631 | $261,800 | $86,500 | $175,300 |
| 2016 | $4,162 | $244,400 | $82,400 | $162,000 |
| 2015 | $4,055 | $238,400 | $82,400 | $156,000 |
| 2014 | $4,023 | $236,500 | $104,200 | $132,300 |
Source: Public Records
Map
Nearby Homes
- 40 Fosdick Rd
- 35 Silva St
- 67 Crystal Lake Dr
- 7 Cedar Dr
- 26 Santana Way Unit 26
- 11 Brockton Ave
- 70 Wall St
- 81 Center St
- 89 Silva St
- Lot1 Elk Run Dr
- 235 Main St
- 11 Opal Ave
- 43 S Meadow Rd
- 114 Meadow St
- 6 Susan Cir
- 13 Pond View Way
- 48 S Meadow Village
- 56 Bunnys Rd
- 29 S Meadow Village
- 55 S Meadow Village
Your Personal Tour Guide
Ask me questions while you tour the home.